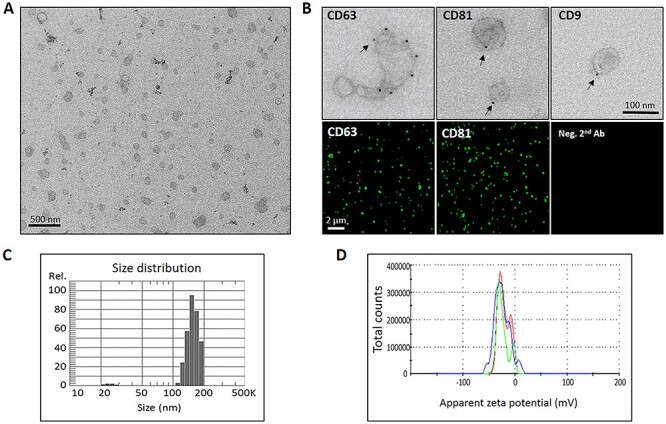
Fig. 2.

Characterization of EVs released by CAFs. (a) Representative (low magnification) EM micrograph of isolated CAF-EVs, (b) Immunogold and immunofluorescence microscopy analysis of EVs for specific exosomal markers CD9, CD63 and CD81, (c) Size distribution of the generated EVs particles, as determined by a Nano Particle Tracking assay, and (d) Zeta Potential Distribution Analyzer of released CAF-EVs. Scale bars = 200 nm (TEM); 100 nm (immunogold), and 2 μm (SIM).
