
FIGURE 2.
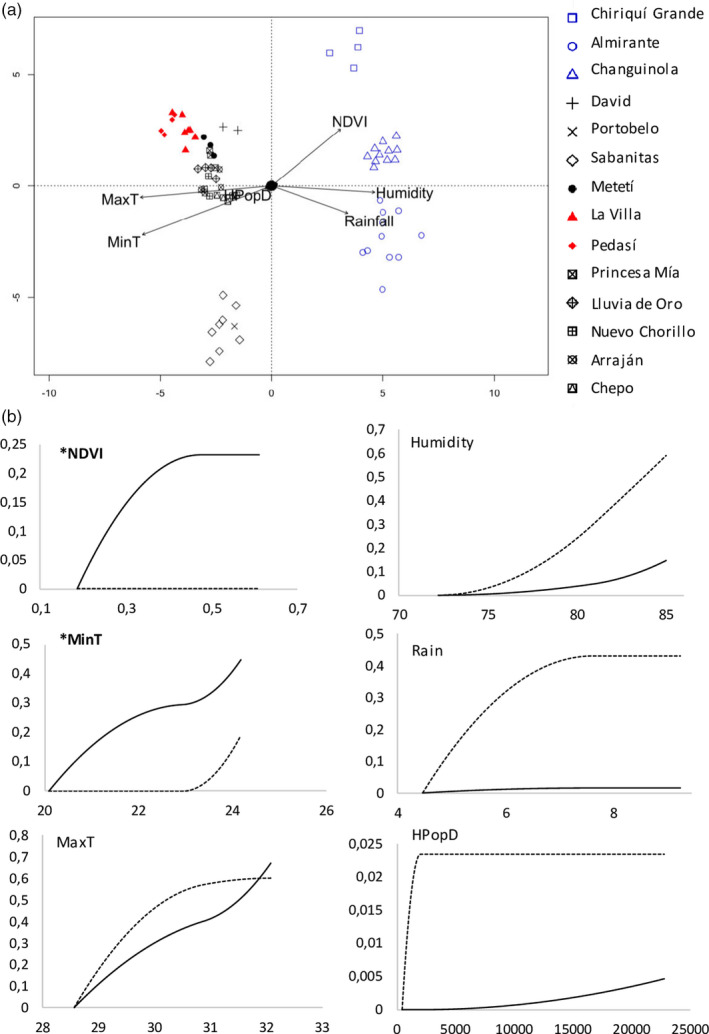
Putative adaptive variation in Aedes aegypti is partitioned between wet and dry tropical environments and associated with temperature and vegetation indices: (a) Ordination triplot of the first two constrained ordination axes of the redundancy analysis representing SNPs either positively or negatively associated with the environmental variables as depicted by the position of the arrows. Ae. aegypti from the wettest region (blue) and driest region (red) are highlighted. (b) Compositional turnover splines for GDM analysis for the reference loci that are putatively neutral (dashed line) and the 128 candidate loci with a signal of local adaptation (black line) in association with NDVI, average minimum temperature (MinT), average maximum temperature (MaxT), average humidity (Humidity), average rainfall (Rain) and human population density (HPopD). For each plot, the y‐axis represents the compositional turnover value and the x‐axis represents the environmental data. A change in allele frequency relative to the reference loci is seen in the putatively adaptive alleles with increasing values of NDVI and MinT, marked in bold with an asterisk