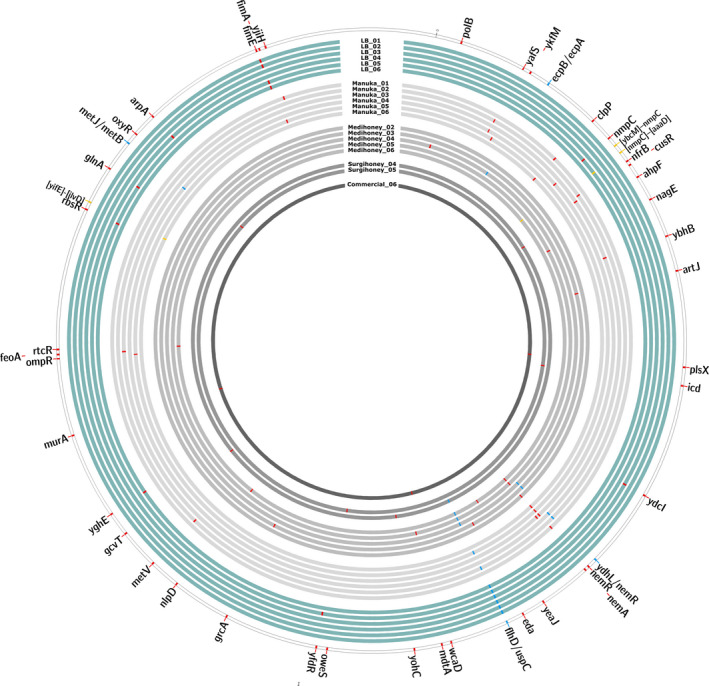
FIGURE 2.

Genetic changes in 20 serially‐passaged isolates of Escherichia coli K‐12 MG1655. The outermost ring represents the ancestral isolate with coloured tiles for all genes in which we found mutations in serially‐passaged isolates. Each inner circle represents one serially‐passaged isolate: in turquoise: control treatment; and in grey: four different honey treatments. Genetic mutations are indicated with coloured tiles: red: mutations in one gene; yellow: intergenetic mutations; and blue: deletions >1000 bp
