
FIGURE 1.
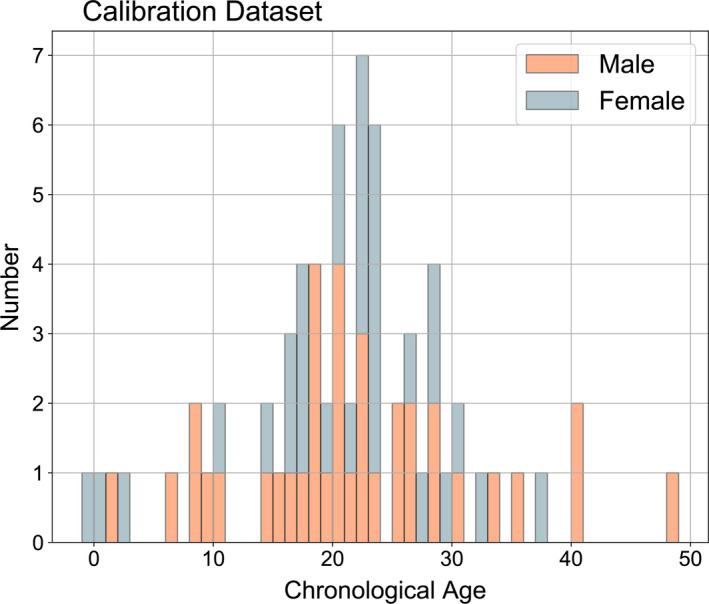
The distribution of chronological age by sex estimated from tooth growth layer groups for the calibration dataset (n = 67). Note that each bin represents one year and negative ages are fetal samples
Official websites use .gov
A
.gov website belongs to an official
government organization in the United States.
Secure .gov websites use HTTPS
A lock (
) or https:// means you've safely
connected to the .gov website. Share sensitive
information only on official, secure websites.
The distribution of chronological age by sex estimated from tooth growth layer groups for the calibration dataset (n = 67). Note that each bin represents one year and negative ages are fetal samples