
FIGURE 2.
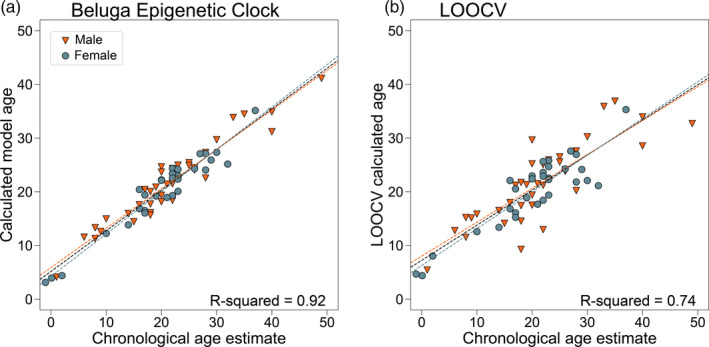
(a) Epigenetic ages calculated using the beluga epigenetic clock regressed against estimated chronological ages (based on GLG) for the calibration dataset. Data for males are represented by orange triangles and those for females are represented by gray‐blue circles. Sex‐specific regression lines as well as the overall regression line are shown (orange dashed line for males, gray/blue dashed line for females, black dashed line for overall regression). The training data showed an overall R 2 = 0.92 (p = 3.50e−38). See Table 3 for all other statistics and sex‐specific values. (b) Leave one out cross‐validation (LOOCV) of the cv.glmnet() model parameters (α = 0.7, lambada.min) with the same color scheme for males and females as panel A. Overall LOOCV R 2 = 0.74 (p = 1.14e−20). See Table 3 for all other statistics and sex‐specific values