
Figure 7.
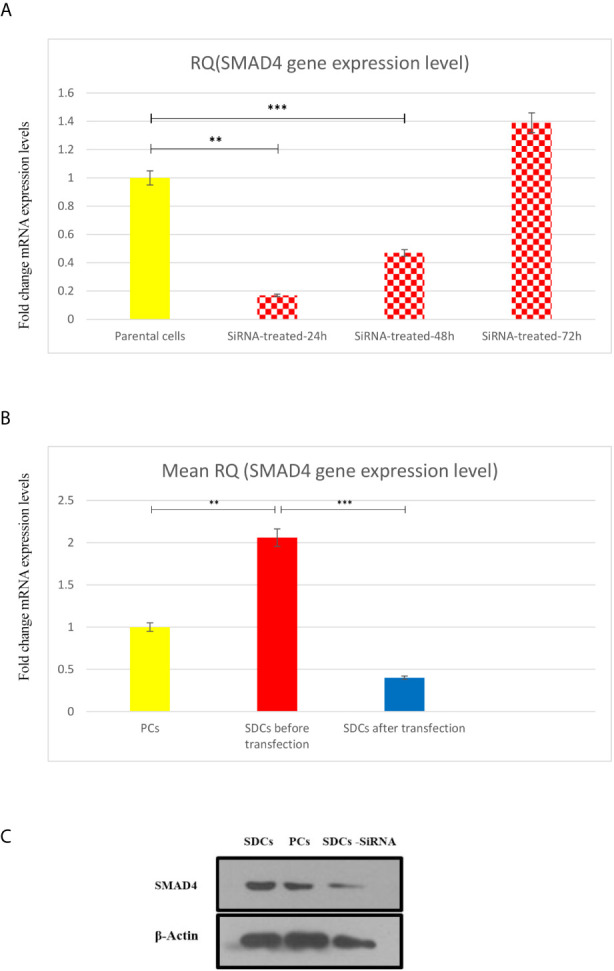
Transfection of Parental Cells (PCs) With SiSMAD4 and its Effect on Expression Level of SMAD4. (A) Relative SMAD4 mRNA level in PCs was measured 24,48 and 72 hours after SMAD4 knockdown compared to PCS. (B) SMAD4 gene expression level of PCs and SDCs before and after transfection with SiSMAD4. (C) Measurement of protein SMAD4 expression by Western blotting in PCs and SDCs before and after SMAD4 knockdown. Data are represented as mean ± SD (n = 3 each). **P < 0.05, and ***P < 0.0001.