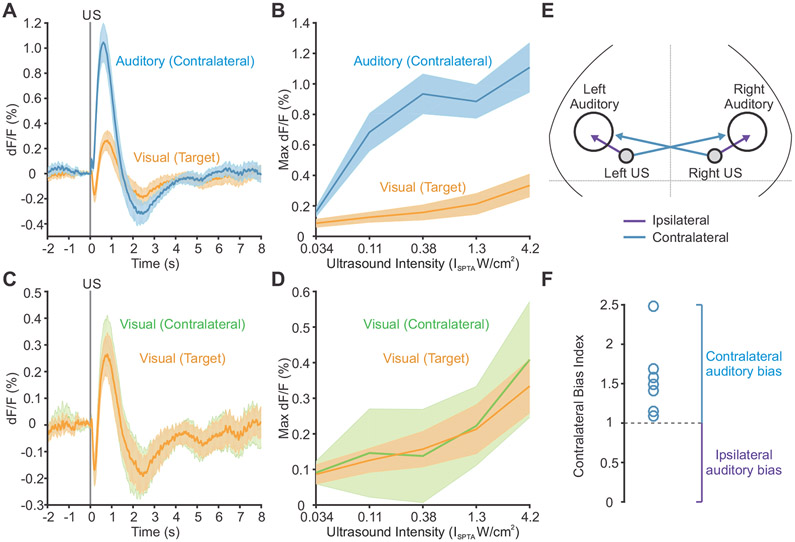
Figure 2. Regional responses to ultrasound.
(A) Response time course to ultrasound at the targeted region of visual cortex and the contralateral auditory cortex.
(B) Maximum dF/F signal at the targeted region of visual cortex and the contralateral auditory cortex in the first 2 sec after onset of ultrasound at different intensities.
(C) Response time course to ultrasound at the targeted region of visual cortex and the contralateral visual cortex.
(D) Maximum dF/F signal at the targeted region of visual cortex and the contralateral visual cortex in the first 2 sec after onset of ultrasound at different intensities. Mean traces in solid, SEM as shaded region (n=10 mice).
(E) Illustration of ipsilateral and contralateral connections between the ultrasound site and auditory cortex.
(F) Contralateral bias index for auditory activation with ultrasound in n=7 mice that were stimulated on both sides of the head.

