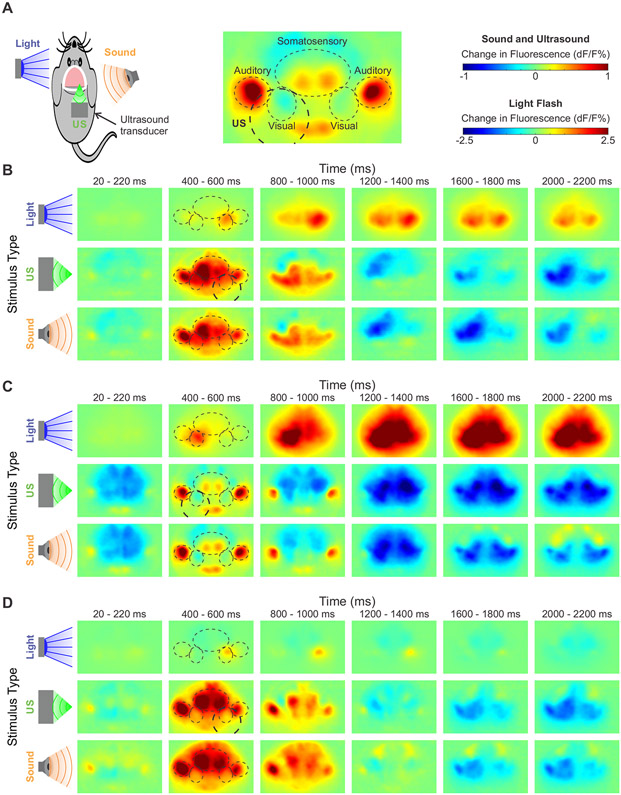
Figure 3. Cortical responses to ultrasound, light flashes, and sound.
(A) Diagram of experimental conditions and relevant cortical regions.
(B-D) Three representative cortical activation maps at different time points in response to light flashes to the contralateral eye, ultrasound (ISPTA 4.2 W/cm2), and sound (108 dB). Relevant cortical regions are outlined to guide the eye. Ultrasound target indicated with thicker dashed circle. dF/F scales as shown in (A).

