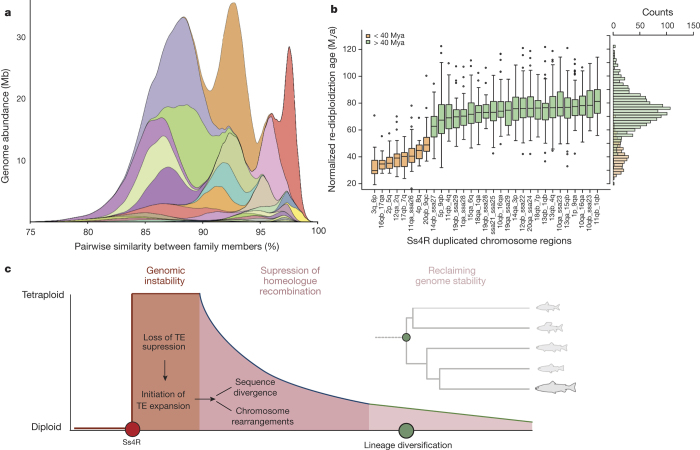
Figure 3. Post-Ss4R rediploidization.
a, Fig. 3a shows a significant and ongoing expansion of transposable elements from the Tc1-mariner superfamily with major peaks at an average of 87%, 93% and 98% similarity between family members. The colours correspond to the same colours as in the box plot in Extended Data Fig. 5. b, Age estimates of the time from homeologue divergence to Salmo–Oncorhynchus divergence for each individual homeologous region. Only chromosome regions with >10 gene trees were included. c, A three-step hypothetical model of post-Ss4R rediploidization (widths of model compartments do not reflect actual time scales). The green circle indicates the beginning of the salmonid radiation.

