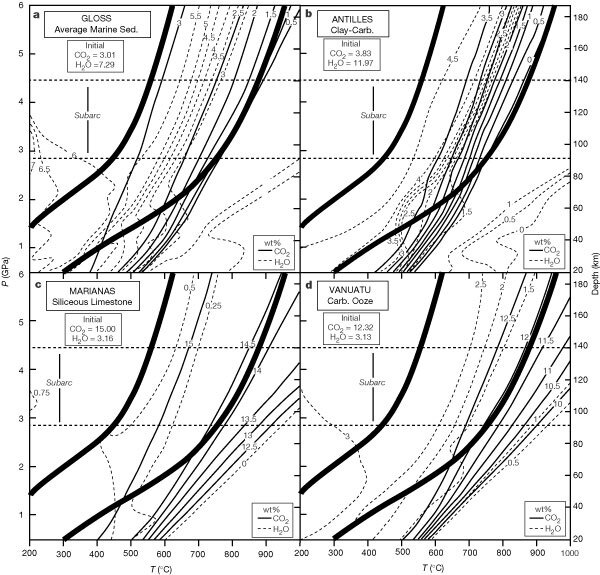
Figure 3. Weight percentages of CO2 and H2O for selected marine sediment bulk rock compositions (see Fig. 1).

a, Gloss; b, Antilles; c Marianas; d, Vanuatu. Heavy curved lines are limiting geotherms (see Fig. 1). Values of the initial wt% CO2 and H2O are given in the insets (from ref. 8). The CO2 and H2O contents of the fluid phase can be determined by subtracting the data in these diagrams from the initial volatile contents of the protoliths.
