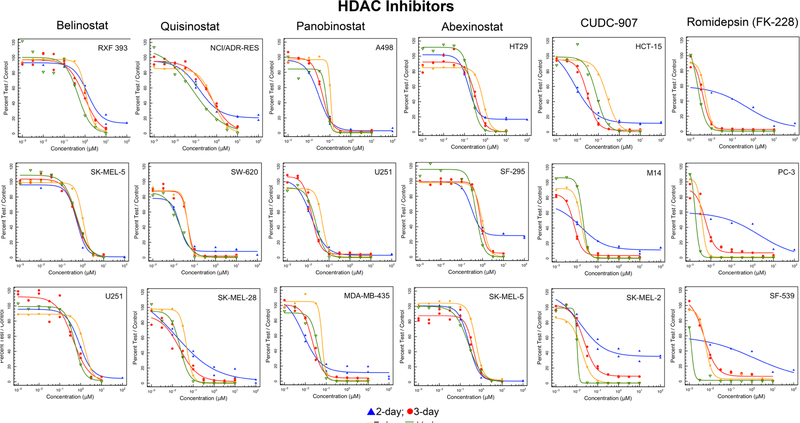
Fig. 3.
Concentration response curves in three representative NCI60 panel cell lines after compound exposure for 2 days (blue), 3 days (red), 7 days (yellow) or 11 days (green) for the histone deacetylase (HDAC) inhibitors belinostat, quisinostat, panobinostat, abexinostat, JNJ-16241199, and romidepsin

