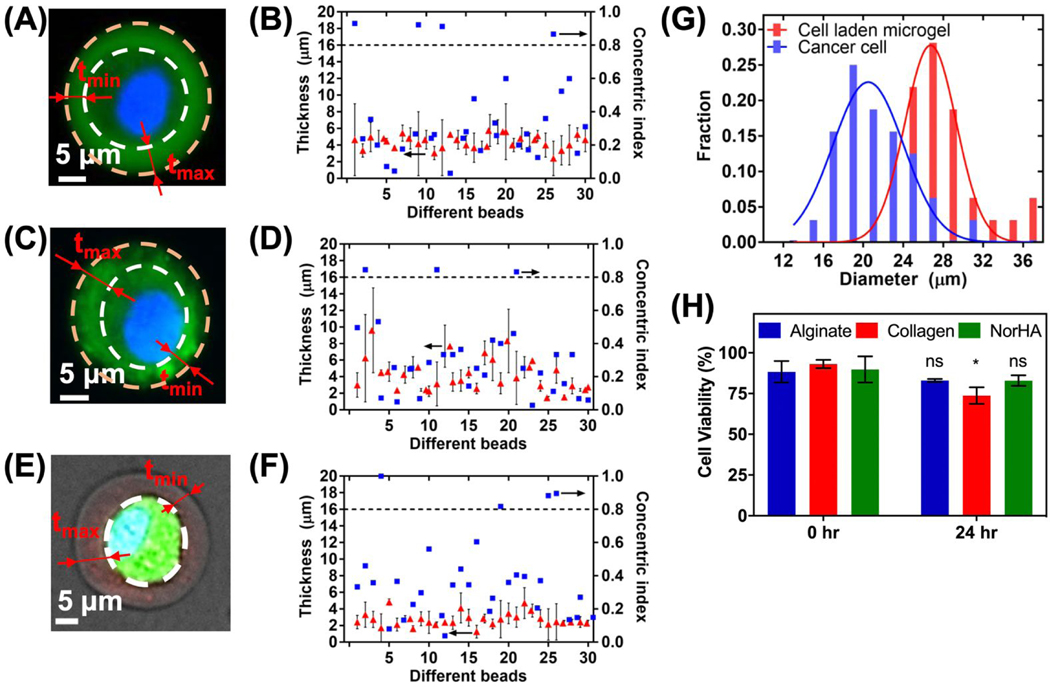
Figure 3.
(A) Representative image of a MDA-MB-231 cell encapsulated in alginate gel particle. The cell occupies the middle region of the bead with lighter fluorescent intensity. White dashed lines delineate cell boundaries. (B) Gel layer thickness (red triangle) and concentric index (blue square) of 30 randomly chosen single-cell-encapsulated alginate gel particles. (C) Representative image of a MDA-MB-231 cell encapsulated in collagen gel particle. (D) Gel layer thickness (red triangle) and concentric index (blue square) of 30 randomly chosen single-cell-encapsulated collagen gel particles (E) Representative image of a MDA-MB-231 cell encapsulated in NorHA gel particle. (F) Gel layer thickness (red triangle) and concentric index (blue square) of 30 randomly chosen single-cell-encapsulated NorHA gel particles (G) Distribution of microgels and cells from (F) depicting conformal coating (H) Viability of single cells encapsulated in alginate or collagen particles right after encapsulation and after 24 hours. Pair sample t test P-values =0.32, 0.028 and 0.15 for alginate, collagen and NorHA encapsulated cells, respectively.

