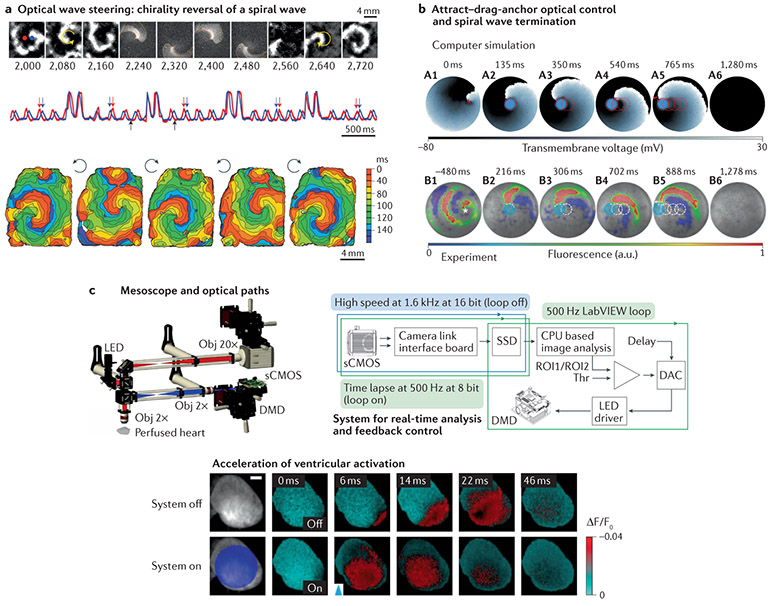
Fig. 6 ∣. Long-term translation of cardiac optogenetics for wave control and feedback control.
The figure shows proof-of-concept results from multiple studies. a ∣ The top images show an anticlockwise spiral wave, an optically applied, computer-generated clockwise spiral wave and the persisting spiral wave after chirality reversal111. The activity signals from the red and blue pixels indicated in the top panel show four light-controlled chirality reversals. Computer-generated, blue-light spirals were imposed at random phases for just over a cycle, as seen in the four higher-intensity transients (middle panel). Black arrows indicate the time period shown in the top panel. Red and blue arrows indicate the switch in order of excitation at the chosen locations due to chirality reversal. The bottom panel shows activation maps for the initial spiral wave and the four resultant spirals after each of the chirality reversals. b ∣ Attract–drag–anchor control of a spiral wave core towards termination112. The top panel shows the successful termination of a spiral wave in silico by capturing the core by using circular depolarizing light pulses and ‘dragging’ the core to the left boundary in a stepwise fashion. The bottom panel shows the successful termination of a spiral wave in vitro in a manner similar to that shown above. For each light spot, the current location of the applied light is indicated with a filled blue circle. The movement of the tip of the spiral wave, as it is anchored to the location of the light spot at previous time points, is indicated in each frame as a dashed red (in silico) or white (in vitro) line, c ∣ The top-left panel shows a fluorescence mesoscope used for optical mapping and photostimulation. Voltage-sensitive dye fluorescence was imaged using a scientific complementary metal oxide semiconductor (sCMOS) camera, and a digital micromirror device provided patterned light for photostimulation. The top-right panel shows the hardware used for real-time analysis of fluorescence and feedback control. The bottom panel shows optical membrane potential images acquired before and after photostimulation (blue arrowhead), revealing acceleration of ventricular activation after large-field illumination of the epicardium of a perfused mouse heart137. CPU, central processing unit; DAC, digital-to-analogue conversion; DMD, digital micromirror device; LED, light-emitting diode; Obj, objective; ROI, region of interest; SSD, solid state drive; Thr, threshold. Panel a modified with permission from REF.111. Panel b modified with permission from REF.112. Panel c modified with permission from REF.137.

