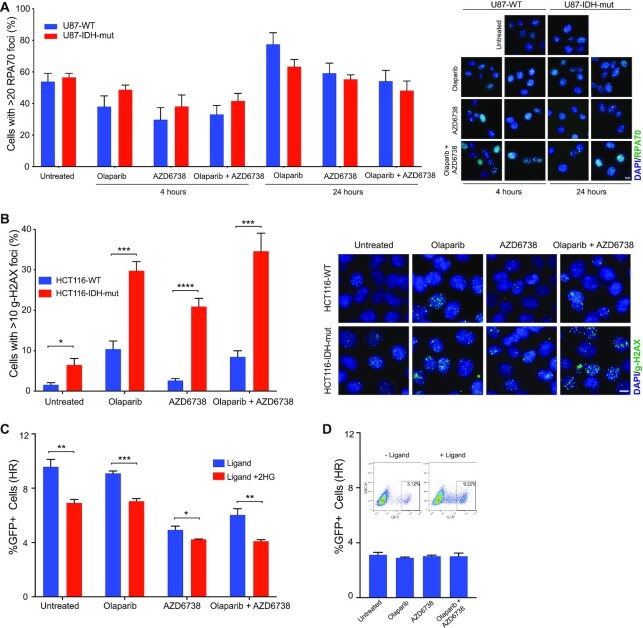
Figure 3.
ATR and PARP inhibition increases unrepaired damage and suppresses HR. (A) U87 WT and IDH1-R132H/+ cells were treated with olaparib (10 μM), AZD6738 (5 nM) or both for 4 and 24 h. Cell were fixed and stained for RPA70 and counterstained with DAPI. Cells with more than 20 RPA70 foci were counted in seven distinct fields. In total 250–350 cells were analyzed. Representative images of cells stained with RPA (green) and counterstained with DAPI (Blue) are shown. The images shown were acquired using a 40× objective lens. The scale bar is 10 μm. (B) HCT116 WT and IDH1-R132H/+ cells were treated with olaparib (1 μM), AZD6738 (500 nM) or both for 24 h. Cell were fixed and stained for γ-H2AX and counterstained with DAPI. Cells with more than 10 γ-H2AX foci were counted in eight distinct fields. In total 800–1000 cells were analyzed. Representative images of cells stained with γ-H2AX (green) and counterstained with DAPI (Blue) are shown. The images shown were acquired using a 40× objective lens. The scale bar is 10 μm. (C) Quantitation of ligand inducible U2OS-DR-GFP assay where cells were cultured with or without 300 μM 2HG for 3 days and with and without olaparib (1 μM), AZD6738 (500 nM) or both for 24 h prior to ligand induction (n = 3). (D) Quantitation of control U2OS-DR-GFP assay without ligand induction. Dotplots show GFP population with and without ligand addition. Error bars represent means ± SEM. ***P < 0.001, **P < 0.01, *P < 0.05.

