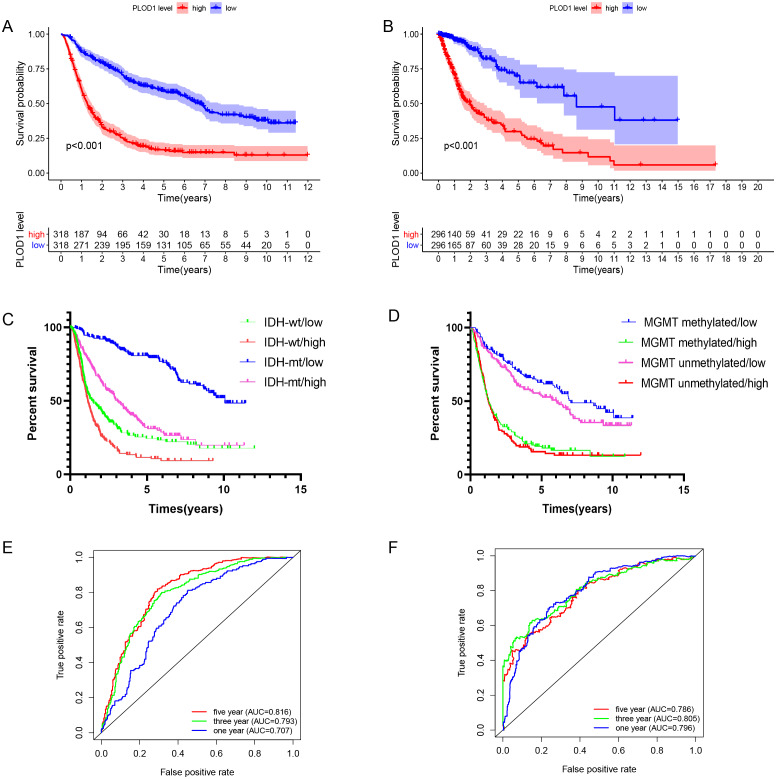
Figure 3. Survival analysis and prognostic values of PLOD1.
Survival analysis of glioma patients in the high PLOD1 and low PLOD1 groups. Red lines represent high expression and blue lines represent low expression. (A) Based on CGGA datasets. (B) Based on TCGA datasets. (C) Relationship between PLOD1 expression and IDH status on glioma survival. Green line represents low expression and IDH wildtype, red line represents high expression and IDH wildtype, blue line represents low expression and IDH mutation, purple line represents high expression and IDH mutation. (D) Relationship between PLOD1 expression and MGMT promoter methylation status on glioma survival. Blue line represents low expression and MGMT promoter methylation, green line represents high expression and MGMT promoter methylation, purple line represents low expression and MGMT promoter unmethylation, red line represents high expression and MGMT promoter unmethylation. Receiver operator characteristic curve analysis of PLOD1. Red lines represent 5 year survival, green lines represent 3 year survival and blue lines represent one 1 survival. (E) Based on CGGA datasets. (F) Based on TCGA datasets.

