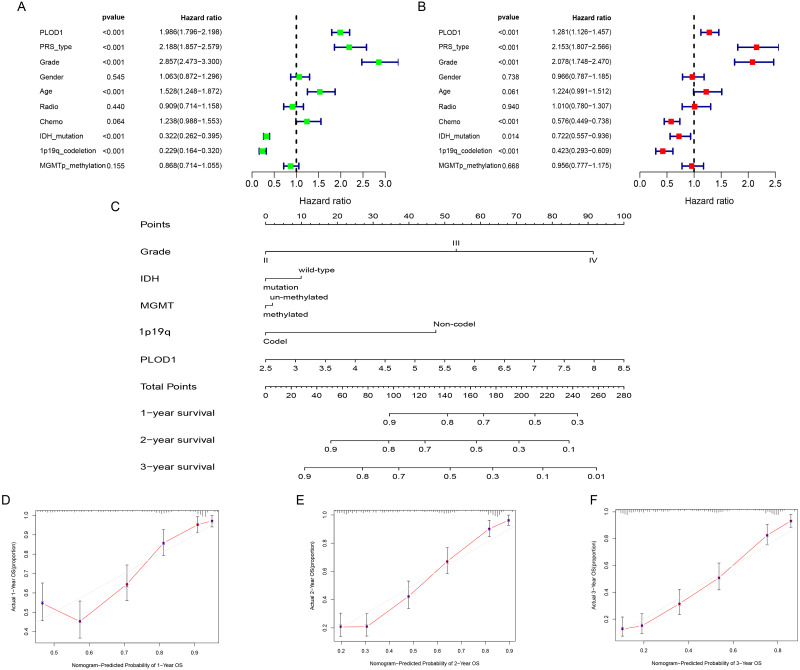
Figure 4. Independent prognostic analysis and development of nomogram of PLOD1 in glioma.
(A) Univariate analysis of PLOD1 based on CGGA datasets. (B) Multivariate analysis of PLOD1 based on CGGA datasets. (C) Prognostic nomogram to predict the survival of glioma patients based on the CGGA datasets. The values of grade, IDH, MGMT, 1p19q and PLOD1 are acquired from each variable axis. The total points on the axis are the sum values of these factors, which can predict the 1-, 2-, and 3-year survival. Calibration curves of the nomogram for predicting survival at 1, 2, and 3 years in the CGGA training cohort (D–F).

