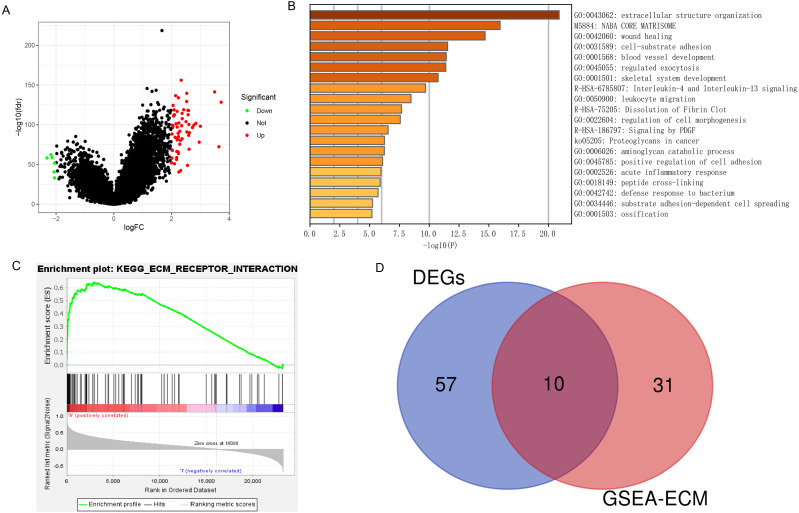
Figure 6. DEGs and enrichment pathways analysis of PLOD1.
(A) Volcano plot of differentially expressed genes. Red nodes represent the significantly up-regulated genes with logFC > 2 and p < 0.05. Green nodes represent the significantly down-regulated genes with logFC < −2 and p < 0.05. (B) Heatmap of enriched terms across DEGs in Metascape analysis. (C) Enrichment plot of ECM receptor interaction pathway from GSEA. (D) The Venn diagram of the common genes, which is obtained by intersecting the core genes of the ECM pathway with DEGs.

