FIGURE 1.
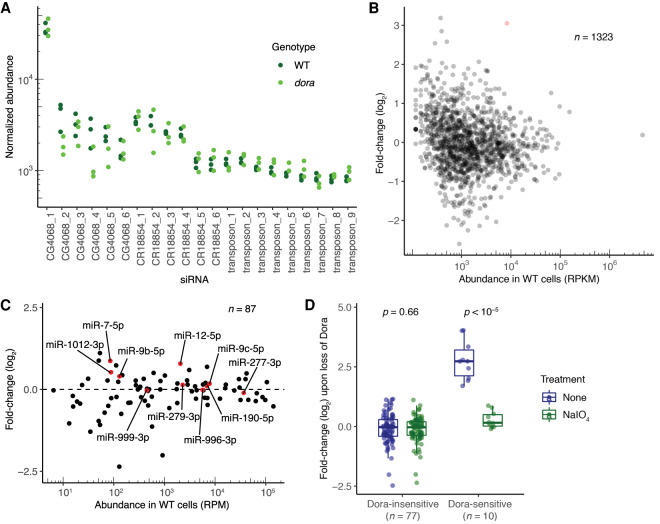
Methylated small RNAs are not susceptible to TDD. (A) Normalized abundance of the most highly expressed individual siRNAs in periodate-treated samples from wild-type (WT, dark green) and dora (light green) cells, as measured using sRNA-seq. Abundance is plotted as reads normalized to a cohort of abundant, Ago2-enriched, Dora-insensitive miRNAs (Supplemental Table S1). Shown are the results from three biological replicates for each genotype, each of which used a different clonal line. Significance was evaluated by a Welch two-sample t-test. (B) Changes in abundance of siRNAs mapping to annotated siRNA-generating loci observed upon loss of Dora in periodate-treated samples analyzed in A. Fold-changes in normalized abundance are plotted as a function of abundance observed in WT cells (RPKM, reads per kilobase per million mapped reads). Each point represents the mean from the three biological replicates, as determined by CuffDiff (Trapnell et al. 2012). The locus for which siRNAs significantly increased upon loss of Dora (CuffDiff adjusted P < 0.05) is indicated in red. (C) Changes in miRNA levels observed upon loss of Dora in periodate-treated samples analyzed A and B. Each point represents the mean from the three biological replicates, as determined by DESeq. Shown in red and labeled are results for Dora-sensitive miRNAs, identified as miRNAs that significantly increased (adjusted P < 2 × 10⁻⁷) upon loss of Dora in a different analysis that examined untreated, total-sRNA samples (Supplemental Fig. S1A; Shi et al. 2020). (D) Changes in miRNA levels observed upon loss of Dora, comparing results for total-sRNA (dark blue) and periodate-treated (dark green) samples for both Dora-sensitive and Dora-insensitive miRNAs. MicroRNAs were classified as Dora sensitive as in C. Significance was evaluated by a Welch two-sample t-test.

