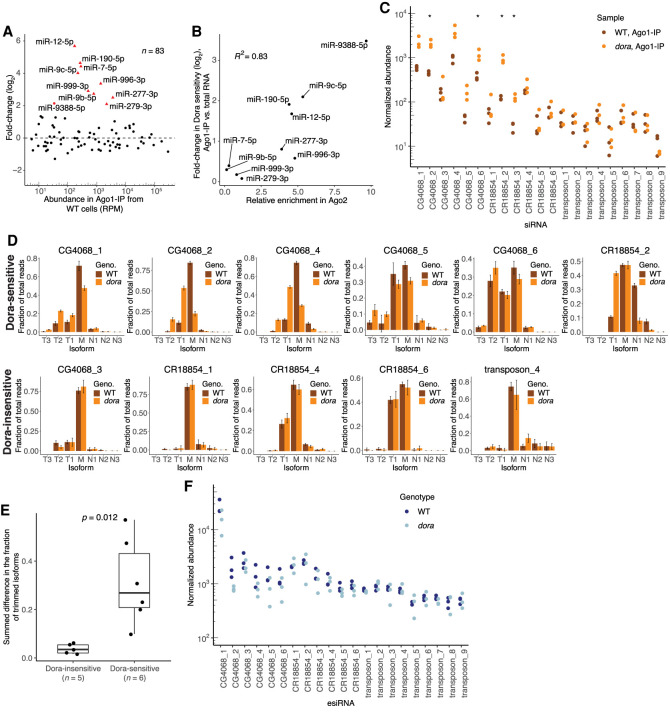
FIGURE 2.
Small RNAs in Ago1 are susceptible to TDD. (A) Changes in levels of Ago1-associated miRNAs observed upon loss of Dora, as measured using sRNA-seq. Analysis was as in Figure 1C, but for miRNAs that copurified with Ago1. Results for miRNAs that significantly increased upon loss of Dora (adjusted P < 10−20) in the Ago1 samples are colored red and labeled, indicating with triangles those previously identified as Dora-sensitive in analyses of total-RNA samples (Supplemental Fig. S1A; Shi et al. 2020). (B) Relationship between the increased Dora sensitivity observed when examining Ago1-associated miRNAs and miRNA enrichment in Ago2. Results are shown for Ago1-associated miRNAs that most significantly increased upon loss of Dora (red points, A). Ago2 enrichment was inferred by dividing the average fraction of miRNA reads corresponding to that miRNA in the periodate-treated libraries by the average fraction of miRNA reads corresponding to that miRNA in the untreated libraries. The increased Dora sensitivity was computed by subtracting the log2-transformed fold-change observed upon loss of Dora in total-sRNA samples from the log2-transformed fold-change observed upon loss of Dora in the Ago1 samples. (C) Normalized abundance of the most highly expressed individual siRNAs in Ago1 samples from wild-type (WT, dark orange) and dora (orange) S2 cells, as measured using sRNA-seq. Significant differences are indicated (*) P > 0.05. Abundance is plotted as reads normalized to a cohort of abundant, Ago1-enriched, Dora-insensitive miRNAs (Supplemental Table S1); otherwise, this panel is as in Figure 1A. (D) Tailing and trimming of Dora-sensitive (top row) and Dora-insensitive (bottom row) siRNAs that passed the expression cutoff (an average of >40 reads across the wild-type samples) in Ago1 samples from wild-type (WT, dark orange) and dora (orange) S2 cells. Fractional abundance was quantified as the fraction of reads that the isoform contributed to the total reads for that siRNA and is shown for mature isoforms (defined as the most abundant isoform in wild-type cells), tailed isoforms with one to three additional nucleotides (N1, N2, N3), and trimmed isoforms with one to three fewer nucleotides (T1, T2, T3). Each of the two genotypes was represented by three clonal lines, and average fractional abundance and standard deviation (error bars) are shown for each isoform. (E) Changes in the fractions of trimmed isoforms observed upon loss of Dora for either the Dora-sensitive or Dora-insensitive siRNAs shown in D. Changes for each siRNA were quantified by summing the differences between the fractional abundances in dora and wild-type S2 cells for each trimmed isoform. Significance was evaluated by a Welch two-sample t-test. (F) Normalized abundance of the most highly expressed individual siRNAs in total-sRNA samples from wild-type (WT, dark blue) and dora (blue) S2 cells, as measured using sRNA-seq. Otherwise, this panel is as in C.

