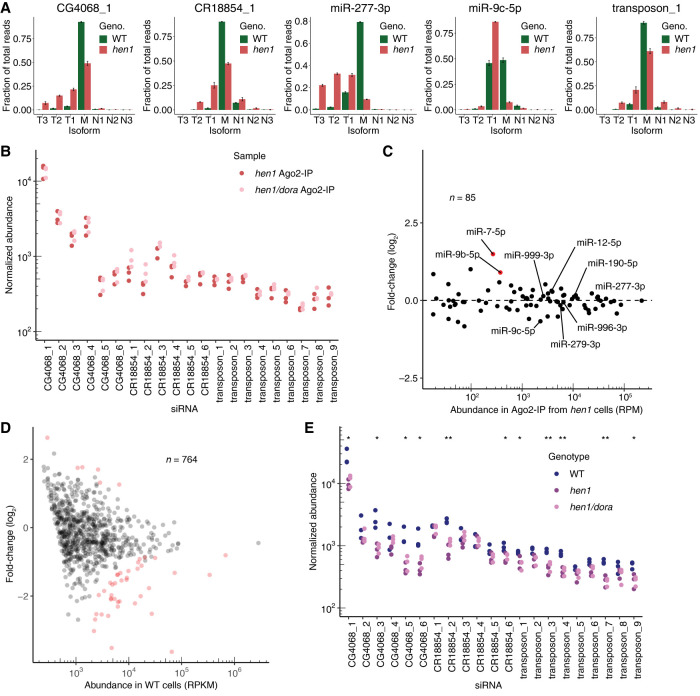
FIGURE 3.
Loss of methylation does not alter sensitivity to TDD. (A) Tailing and trimming of Ago2-associated small RNAs from wild-type (WT, green) and hen1 (red) S2 cells. Ago2-associated small RNAs were enriched by either periodate treatment (WT) or co-IP with FLAG-Ago2 (hen1) (Supplemental Fig. S3B). Otherwise, this panel is as in Figure 2D. (B) Normalized abundance of individual Ago2-associated siRNAs from hen1 and hen1/dora cells, as measured using sRNA-seq. Ago2-associated siRNAs were isolated by IP of FLAG-Ago2. Otherwise, this panel is as in Figure 1A. (C) Changes in levels of Ago2-associated miRNAs observed upon loss of Dora in hen1 cells. Ago2-associated miRNAs were isolated by IP of FLAG-Ago2. Each point represents the mean from three biological replicates, as determined by DESeq. Results for miRNAs sensitive to loss of Dora in wild-type cells are labeled (Supplemental Fig. S1A; Shi et al. 2020), and results for miRNAs significantly up-regulated (P < 10−3) upon Dora loss in these Ago2 samples are colored in red. (D) Changes in abundance of siRNAs mapping to annotated siRNA-generating loci observed upon loss of Hen1. Fold-changes in normalized abundance are plotted as a function of abundance observed in WT cells (RPKM, reads per kilobase per million mapped reads), as determined by CuffDiff. Differential expression was determined by DESeq, after normalizing to a cohort of abundant, Ago1-enriched, Dora-insensitive miRNAs (Supplemental Table S1). Each point represents the mean from the three biological replicates. The loci for which siRNAs significantly changed upon loss of Hen1 (DESeq adjusted P < 0.05) are indicated in red. (E) Normalized abundance of individual siRNAs in total-sRNA wild-type (WT), hen1, and hen1/dora samples. Note that the WT data are those of Figure 2D, replotted here for comparison, and that the normalization was performed as in Figure 2D. Significance was evaluated by ANOVA and the Tukey test.

