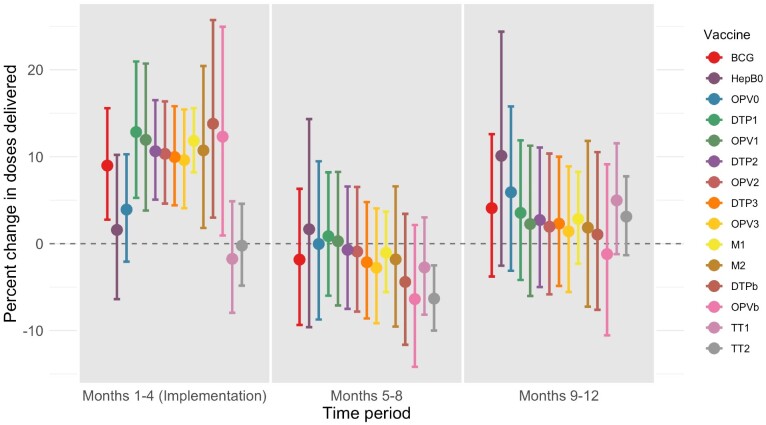
Figure 2.
Regression results: percent change in doses delivered in treated districts during three 4-month periods. Notes: This figure shows estimates of the effect of IMI on doses delivered, measured as a percent change in doses delivered in each of three time periods [(1) during implementation (Months 1–4); (2) the 4 months following implementation (Months 5–8); and (3) the 4 months after that (Months 9–12). Covariate values (urbanization and baseline coverage) are fixed at their mean values. To show percent change, we first exponentiate regression coefficients (because models are fit with a log link function), then subtract one and multiply by 100. To calculate 95% confidence intervals on the same scale, we first calculate 95% confidence intervals on the log scale using assumptions from the normal distribution, and then exponentiate the interval bounds, subtract one and multiply by 100.

