Abstract
Background
Some recent studies on insulin receptor tyrosine kinase substrate (IRTKS) have focused more on its functions in diseases. However, there is a lack of research on the role of IRTKS in carcinomas and its mechanism remains ambiguous. In this study, we aimed to clarify the role and mechanism of IRTKS in the carcinogenesis of colorectal cancer (CRC).
Methods
We analysed the expression of IRTKS in CRC tissues and normal tissues by researching public databases. Cancer tissues and adjacent tissues of 67 CRC patients who had undergone radical resection were collected from our center. Quantitative real-time polymerase chain reaction and immunohistochemistry were performed in 52 and 15 pairs of samples, respectively. In vitro and in vivo experiments were conducted to observe the effect of IRTKS on CRC cells. Gene Set Enrichment Analysis and Metascape platforms were used for functional annotation and enrichment analysis. We detected the protein kinase B (AKT) phosphorylation and cell viability of SW480 transfected with small interfering RNAs (siRNAs) with or without basic fibroblast growth factor (bFGF) through immunoblotting and proliferation assays.
Results
The expression of IRTKS in CRC tissues was higher than that in adjacent tissues and normal tissues (all P < 0.05). Disease-free survival of patients with high expression was shorter. Overexpression of IRTKS significantly increased the proliferation rate of CRC cells in vitro and the number of tumor xenografts in vivo. The phosphorylation level of AKT in CRC cells transfected with pLVX-IRTKS was higher than that in the control group. Furthermore, siRNA-IRTKS significantly decreased the proliferation rate of tumor cells and the phosphorylation level of AKT induced by bFGF.
Conclusion
IRTKS mediated the bFGF-induced cell proliferation through the phosphorylation of AKT in CRC cells, which may contribute to tumorigenicity in vivo.
Keywords: colorectal cancer, proliferation, IRTKS, AKT, bFGF
Introduction
The morbidity and mortality of colorectal cancer (CRC) ranked third among all carcinomas in 2018 [1]. CRC poses a serious threat to human health and is one of the leading causes of death. The morbidity and mortality from CRC have decreased slightly in developed countries but increased in developing countries [2]. Therefore, research on the pathogenesis and treatment of CRC is crucial.
With the development of molecular oncology, an increasing number of metabolism-related genes have been found to play vital roles in carcinomas [3–5]. Insulin receptor tyrosine kinase substrate (IRTKS), as a member of the insulin receptor substrate family, is widely distributed in human tissues and its expression is highest in the digestive system [6, 7]. Activated tyrosine kinases such as insulin receptor and growth-factor receptors cause phosphorylation of IRTKS, which then binds to phosphatidylinositol 3-kinase (PI3K), growth-factor receptor-bound protein 2 (Grb2), etc., to initiate downstream signaling pathways and regulate physiological processes such as cell growth, differentiation, and metabolism [6, 8].
The IRTKS gene is located in human chromosome 7q21.3–q22.1, containing 14 exons. The encoded protein contains 511 amino acids and multiple domains, and has a molecular weight of 57 kDa. The main functional domains include the inverse Bin-Amphiphysin-Rvs (I-BAR), Src homology 3 (SH3), and actin-binding domains [8, 9]. As a scaffolding protein, IRTKS plays an important role in maintaining cell structure and function [10]. Briefly, membrane enzyme-linked receptor binds and activates IRTKS through its intracellular segment, which then interacts with the effector containing the Src homology 2 (SH2) domain.
In recent years, some studies have reported on IRTKS, mainly with regard to its functions in diseases [11, 12]. However, there has been a lack of research on the role of IRTKS in carcinomas and its mechanism remains ambiguous [13, 14]. The purpose of this study is to optimize the pathogenesis and guide the diagnosis and treatment of CRC through the research of IRTKS.
Materials and methods
Patient samples
We collected the cancer tissues and adjacent tissues of 67 CRC patients who had undergone radical resection between July 2012 and July 2013 at Cancer Hospital, Chinese Academy of Medical Sciences and Peking Union Medical College (Beijing, China). All tumors were pathologically diagnosed as colorectal adenocarcinoma. Exclusion criteria of this study were as follows: (i) patients who underwent chemotherapy, radiotherapy, or other antitumor therapies before operation; (ii) patients with a history of other malignancies; and (iii) patients who were lost to follow-up. Fifty-two pairs of frozen tissue samples were performed with RNA extraction and quantitative real-time polymerase chain reaction (qRT-PCR) assays. The other 15 pairs of formalin-fixed paraffin-embedded tissues were collected for the immunohistochemistry (IHC) assay. Human tissues were obtained with informed consent and the design of this study was approved by the Ethics Committee of Cancer Hospital, Chinese Academy of Medical Sciences, and Peking Union Medical College.
RNA extraction, reverse transcription, and qRT-PCR
Total RNA was extracted using Trizol reagent (Invitrogen; Carlsbad, CA, USA). The concentration and quantity of RNA were assessed using a spectrophotometer. Qualified RNA was reverse transcribed using a RevertAid First Strand cDNA Synthesis Kit (Thermo Fisher Scientific; Waltham, MA, USA). Then, qRT-PCR was performed using a Bio-rad iCycler PCR System (Hercules, CA, USA) and SYBR green dye (TaKaRa; Beijing, China), according to the manufacturer’s protocol. The following primers were used to amplify a 203-bp PCR product for IRTKS: forward, 5′-GAATTCCAAGCTGCCTCGGT-3′ and reverse, 5′-GGGGCATCTTTGGTGAGCA-3′. Glyceraldehyde-3-phosphate dehydrogenase (GAPDH) was used as an endogenous control with the following primers: forward, 5′-CTCTGCTCCTCCTGTTCGAC-3′ and reverse, 5′-GCGCCCAATACGACCAAATC-3′. The expression level was calculated and normalized using the 2-ΔΔCt method relative to GAPDH.
Antibodies, plasmids, and siRNAs
Anti-IRTKS antibody (ab226344, 1:5000) for immunoblotting and anti-IRTKS antibody (ab211301, 1:600) for IHC were obtained from Abcam (Cambridge, MA, USA). Anti-AKT antibody (#4691, 1:1000) and anti-pAKT (Ser473) antibody (#4060, 1:2000) were from Cell Signaling Technology (Beverly, MA, USA). Anti-FGFR1 antibody (60325, 1:2000) was from Proteintech (Rosemont, IL, USA). Anti-β-actin antibody (A1978, 1:10000) was from Sigma (St. Louis, MO, USA). Secondary antibodies (#7074/7076, 1:10000) were purchased from Cell Signaling Technology.
IRTKS-3*FLAG, encoding full-length IRTKS with three N-terminal FLAGs, was synthesized and cloned into the vector pLVX-Puro-CMV by Vigene Biosciences (Jinan, Shandong, China). Two small interfering RNAs (siRNAs) against IRTKS were used: siRNA-1 (sense, 5′-GCA CCU ACC GGA AUG UUA UTT-3′ and anti-sense, 5′-AUA ACA UUC CGG UAG GUG CTT-3′) and siRNA-2 (sense, 5′-CCA GUC CCU UGA UCG AUA UTT-3′ and anti-sense, 5′-AUA UCG AUC AAG GGA CUG GTT-3′). In addition, siRNA-NC (sense, 5′-UUC UCC GAA CGU GUC ACG UTT-3′ and anti-sense, 5′-ACG UGA CAC GUU CGG AGA ATT-3′) was used as a control. All siRNAs were designed and chemically synthesized by GenePharma (Suzhou, Jiangsu, China).
Protein extraction and immunoblotting
Protein lysates were prepared by incubating cells in a radioimmunoprecipitation assay (RIPA) lysis buffer with protease inhibitor cocktail and phosphatase inhibitor cocktail (Applygen; Beijing, China) for 30 min on ice. Then, the supernatant was collected after centrifugation at 13,000 g for 10 min. Ten microliters of supernatant were removed for concentration measurement. The remaining volume was mixed with 4× loading buffer and boiled for 10 min. Protein samples were separated using sodium dodecyl sulfate–polyacrylamide gel electrophoresis (SDS–PAGE) and then transferred onto a polyvinylidene fluoride membrane, which was blocked in tris-buffered saline (TBS)-Tween with 5% (w/v) skim milk and stained overnight at 4°C with primary antibodies. The membrane was washed, stained with secondary antibodies, and detected using ChemiDoc Imaging Systems (Bio-rad). The grayscale values of the bands were measured by ImageJ software version 1.51 (National Institutes of Health; Bethesda, MD, USA).
Cell culture and cell transfection
All human cell lines were purchased from ATCC, Manassas, VA, USA. siRNAs were transfected into SW480 and HT29 using Lipofectamine 2000 according to the manufacturer’s instructions (Invitrogen). pLVX-IRTKS and pLVX-vector were transfected into RKO and SW620 using lentiviral vector according to the manufacturer’s instructions (Vigene Biosciences). After 72 h, puromycin was used to select stable monoclones.
MTT assay
The proliferation ability of cells transfected with plasmids or siRNAs was observed in 96-well plates using 3-(4,5-dimethylthiazol-2-yl)-2,5-diphenyltetrazolium bromide (MTT) assay. Each group had five duplicate wells and each well was inoculated with 5 × 10⁴ cells. Results were collected on the first, third, fifth, and seventh days, respectively. Each well was filled with 20 µL of 5 mg/mL MTT. After 4 h, the supernatant was discarded and 200 µL dimethyl sulfoxide (DMSO) was added to each well and horizontally shaken for 10 min. Plates were read using an iMark™ Microplate Absorbance Reader (Bio-rad) at 490 nm.
Colony-formation assay
Cells transfected with plasmids or siRNAs were seeded in six-well plates with 3 × 10³ cells per well for colony formation. Fresh medium was replaced 6 days later and proliferating colonies were dyed with crystal violet after 12 days. ImageJ software version 1.51 (National Institutes of Health) was used to save images and count colonies.
IHC assay
Tissue slides (CRC tissues and adjacent tissues) and xenograft slides were serially deparaffinized in xylene, rehydrated in decreasing concentrations of ethanol, and blocked in 3% bovine serum albumin for 30 min. The sections were incubated with anti-IRTKS antibody at 4°C overnight, then incubated with horseradish peroxidase conjugated antibody at room temperature for 1 hour. The signals were detected using a Diaminobenzidine Substrate Kit (Thermo Fisher Scientific; Waltham, MA, USA) according to the manufacturer’s instructions. The overall immunohistochemical scores (histoscore) in this study were defined as the percentages of positive cells multiplied by staining intensity for the cells (0 = negative, 1 = weak, 2 = moderate, 3 = strong). Scores ranged from 0 to 300 (100% multiplied by 3).
Tumor xenografts in vivo
Male BALB/c-nude mice (18–20 g) were purchased from HFK Bioscience Co. Ltd (Beijing, China). Each mouse was subcutaneously inoculated with 1 × 10⁶ cells. The kinetics of tumor formation was assessed by measuring the tumor sizes with a digital caliper at 3-day intervals. Tumor volume was calculated using the following formula: volume = 0.5 × length × width2. Tumor weight was measured after separation from each mouse. All applicable international, national, and institutional guidelines for the care and use of animals were followed.
RNA sequencing
Qualified RNA samples extracted from RKO-vector and RKO-IRTKS cells were selected for purification and reverse transcription. The molarity of the library was quantified by qRT-PCR and adjusted to 2 nM. Ten microliters library was mixed with 10 μL NaOH and incubated at room temperature for 5 min. Then, the mixture was added to 980 μL prechilled hybridization buffer to dilute the final concentration of the library to 20 pM. Molecules in the library were combined with primers fixed on the Flowcell by cBot system (Illumina; San Diego, CA, USA). Finally, sequencing was performed using the Illumina NovaSeq 6000 System. Data had passed quality control before differentially expressed genes were identified based on |Fold Change| ≥ 2 and P < 0.05. Acquired data were further analysed for functional annotation and enrichment analysis by Gene Set Enrichment Analysis (GSEA) software version 4.0.1 (National Institutes of Health) and Metascape platform (http://metascape.org).
Statistical analysis
Categorical variables were presented as frequency and percentage. Enumeration of the data was performed using the χ2 test and data were ranked using the Mann–Whitney U test. Continuous variables were expressed as mean ± standard deviation. Statistical evaluation of the in vitro and in vivo experiments was calculated using the Student’s t-test. Multiple group comparisons were analysed by one-way analysis of variance. Kaplan–Meier survival curves and log-rank tests were used for survival analysis of patients with CRC. A P-value <0.05 was considered significant (*P < 0.05; **P < 0.01; ***P < 0.001).
Results
IRTKS is upregulated in CRC tissues and high expression is associated with poor survival of patients
To explore the role of IRTKS in CRC, we analysed The Cancer Genome Atlas (TCGA) and Gene Expression Omnibus (GEO) databases. The results showed that the mRNA expression of IRTKS in CRC tissues was significantly higher than that in adjacent tissues and normal tissues (all P < 0.001) (Figure 1A and B). In the GEO database, we found that the disease-free survival (DFS) rate of patients with high expression was significantly lower than that of patients with low expression, based on Kaplan–Meier survival analysis (hazard ratio [HR] = 2.06, P = 0.014) (Figure 1C).
Figure 1.
The expression level of IRTKS in different tissues and its relationship with the survival of CRC patients based on public databases. Elevated mRNA expression of IRTKS in CRC tissues compared with adjacent tissues or normal tissues from (A) TCGA database and (B) GEO database. (C) High expression of IRTKS indicates poor prognosis for disease-free survival, given by GSE30378. HR, hazard ratio.
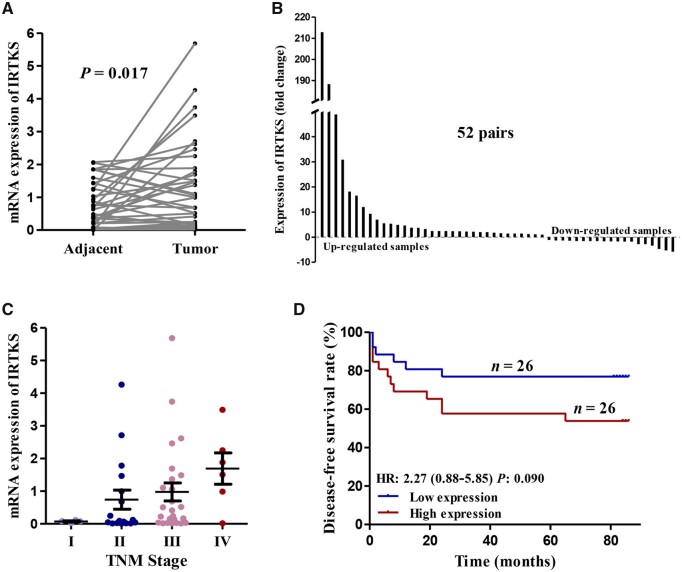
We also investigated the mRNA expression of IRTKS and its relationship with oncological outcome in 52 pairs of samples (Table 1). qRT-PCR data revealed that the IRTKS expression was significantly higher in CRC tissues than that in the corresponding adjacent tissues (P = 0.017) (Figure 2A and B). The expression level of IRTKS increased in parallel with the progression of the American Joint Committee on Cancer (AJCC) TNM stage (Figure 2C). In addition, survival curves demonstrated that the expression of IRTKS was negatively associated with the DFS rate of patients (Figure 2D). We also stratified the survival studies by AJCC TNM stage to eliminate its interference. The prognosis of patients with high expression was worse than that of patients with low expression at the same stage (Supplementary Figure 1A).
Table 1.
Associations between IRTKS expression and clinicopathological characteristics in 52 patients with CRC
| Characteristic | No. of cases (n = 52) | IRTKS expression |
P-value | |
|---|---|---|---|---|
| Low (n = 26) | High (n = 26) | |||
| Age (years) | 0.266 | |||
| <60 | 28 (53.8%) | 12 (46.2%) | 16 (61.5%) | |
| ≥60 | 24 (46.2%) | 14 (53.8%) | 10 (38.5%) | |
| Sex | 0.560 | |||
| Male | 34 (65.4%) | 16 (61.5%) | 18 (69.2%) | |
| Female | 18 (34.6%) | 10 (38.5%) | 8 (30.8%) | |
| BMI | 0.777 | |||
| 18.5–24.9 | 31 (59.6%) | 15 (57.7%) | 16 (61.5%) | |
| 25.0–30.0 | 21 (40.4%) | 11 (42.3%) | 10 (38.5%) | |
| AJCC TNM stage | 0.013 | |||
| Stage I | 4 (7.7%) | 4 (15.4%) | 0 (0.0%) | |
| Stage II | 17 (32.7%) | 10 (38.5%) | 7 (26.9%) | |
| Stage III | 25 (48.1%) | 11 (42.3%) | 14 (53.8%) | |
| Stage IV | 6 (11.5%) | 1 (3.8%) | 5 (19.2%) | |
| Grade | 0.643 | |||
| Grade I | 9 (17.3%) | 4 (15.4%) | 5 (19.2%) | |
| Grade II | 30 (57.7%) | 17 (65.4%) | 13 (50.0%) | |
| Grade III | 13 (25.0%) | 5 (19.2%) | 8 (30.8%) | |
| Histological type | 0.827 | |||
| Adenocarcinoma | 39 (75.0%) | 20 (76.9%) | 19 (73.1%) | |
| Mucinous adenocarcinoma | 10 (19.2%) | 4 (15.4%) | 6 (23.1%) | |
| Signet ring cell carcinoma | 3 (5.8%) | 2 (7.7%) | 1 (3.8%) | |
| Location | 0.165 | |||
| Colon | 27 (51.9%) | 16 (61.5%) | 11 (42.3%) | |
| Rectum | 25 (48.1%) | 10 (38.5%) | 15 (57.7%) | |
Figure 2.
The expression level of IRTKS in different tissues and its relationship with TNM stage or prognosis of CRC based on our own data. (A) The mRNA expression of IRTKS and (B) the fold change of IRTKS in 52 pairs of samples from our center. (C) The relationship between the expression of IRTKS and the AJCC TNM stage. (D) The disease-free survival for patients with high expression is lower than for those with low expression in our data. HR, hazard ratio. Upregulated samples: tumor/adjacent; downregulated samples: adjacent/tumor.
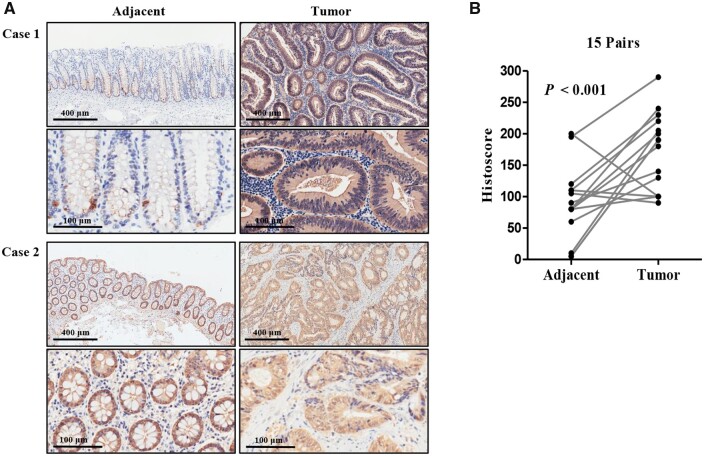
To verify the protein level in CRC, we examined it in 15 cases of CRC tissues and matched adjacent tissues by IHC analysis. The accuracy of IHC was validated by conducting PCR and Western-blot assays on the same samples. As shown in Supplementary Figure 1B, the results of the IHC assay are consistent with those of the PCR and Western-blot assays. Figure 3A shows that IRTKS was primarily localized in the cytoplasm and its expression in tumor tissues was dramatically increased. Specifically, for 12 of the 15 cases, the IRTKS histoscores were higher in tumor tissues than in adjacent tissues. The average histoscore of the tumor tissues was 173.7 ± 15.7 compared with the adjacent tissues, which had an average histoscore of 88.7 ± 15.0 (Figure 3B).
Figure 3.
Comparing the protein level of IRTKS between adjacent tissues and tumor tissues. (A) Representative images depicting IHC staining of IRTKS in tumor and para-tumor tissues. Case 1 represents the high-expressing CRC sample and case 2 represents the low-expressing CRC sample. Upper panels were captured at a magnification of 100× (scale bar, 400 µm) and lower panels were captured at a magnification of 400× (scale bar, 100 µm). (B) Histoscores of IRTKS in 15 pairs of human intestinal sections. Histoscore, immunohistochemical score.
IRTKS promotes the proliferative capacity of CRC cells in vitro
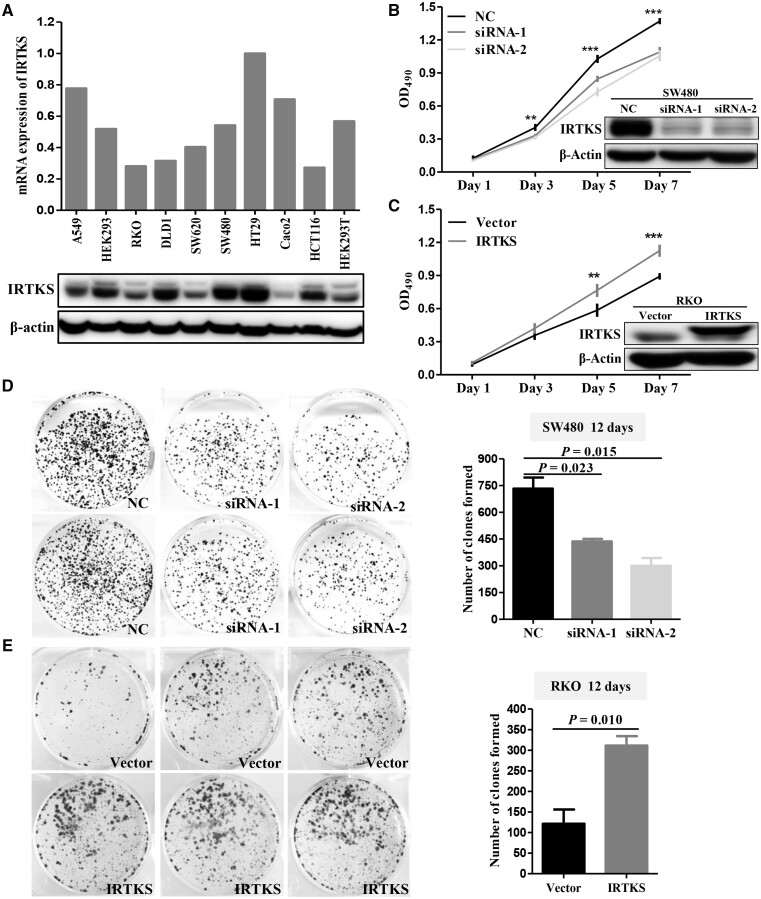
The expression of IRTKS in seven CRC cell lines and three control cell lines (A549, HEK293, and HEK293T) were detected by the qRT-PCR and Western-blot methods, respectively (Figure 4A). Based on these results, SW480 and HT29 cells with high expression were chosen to transiently transfect with siRNA-NC and siRNA-IRTKS. Meanwhile, RKO and SW620 cells with low expression were chosen to stably transfect with pLVX-vector and pLVX-IRTKS.
Figure 4.
IRTKS promotes the proliferative capacity of CRC cells in vitro. (A) qRT-PCR shows the mRNA expression level of IRTKS and immunoblotting shows the protein expression level of IRTKS in 10 cell lines. (B) The proliferative capacity of SW480 cells transfected with corresponding siRNAs was detected using MTT. An immunoblotting assay was performed to assess the efficiency of knock-down. (C) The proliferative capacity of RKO cells transfected with corresponding plasmids was detected using MTT. An immunoblotting assay was performed to assess the efficiency of overexpression. (D) IRTKS knock-down weakens the colony formation of SW480 cells and (E) IRTKS overexpression enhances the colony formation of RKO cells. Histograms are the statistical results. NC, negative control. *P < 0.05; **P < 0.01; ***P < 0.001.
MTT assay results indicated that the proliferation of SW480 cells was significantly decreased after IRTKS knock-down (Figure 4B). Correspondingly, overexpression of IRTKS enhanced the proliferative capacity of RKO cells (Figure 4C). Colony-formation assay results indicated that downregulation of IRTKS significantly decreased the number of colonies compared with siRNA-NC (Figure 4D). The proliferation and colony-formation efficiencies of RKO cells transfected with pLVX-IRTKS were significantly increased compared with cells transfected with pLVX-vector (Figure 4E). Also, pools of clones were used to control for confounding effects seen in monoclones (Supplementary Figure 1C and D). Experiments on HT29 and SW620 cells yielded similar results (Supplementary Figure 2).
IRTKS enhances the tumorigenicity of CRC cells in vivo
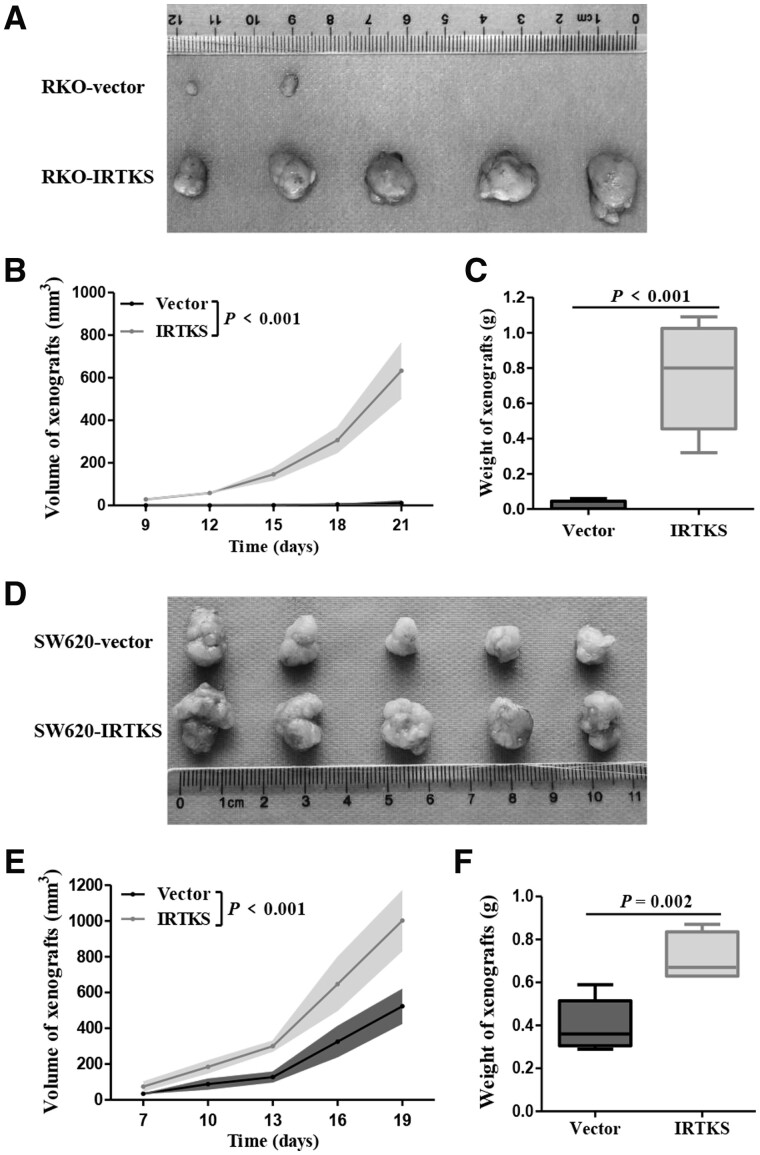
Human tumor cells were transplanted into nude mice to detect whether IRTKS could play an identical role on cell proliferation in vivo. RKO and SW620 cells transfected with pLVX-IRTKS or pLVX-vector were injected subcutaneously into male BALB/c-nude mice. Tumors developed in two (40%) and five (100%) of the mice in the RKO-vector group and RKO-IRTKS group, respectively (Figure 5A). The volume and weight of xenografts formed from RKO-IRTKS were significantly higher than those formed from the RKO-vector (both P < 0.001) (Figure 5B and C).
Figure 5.
IRTKS enhances the tumorigenicity of CRC cells in vivo. (A) Images of xenografts derived from nude mice inoculated with RKO-vector cells or RKO-IRTKS cells. (B) Tumor volume was monitored with a digital caliper every 3 days. (C) Tumor weight was calculated at the endpoint. (D) Images of xenografts derived from nude mice inoculated with SW620-vector cells or SW620-IRTKS cells. (E) Tumor volume. (F) Tumor weight.
To exclude the heterogeneity of CRC cells, we did the same experiment with SW620 cells and obtained similar results. All of the mice injected with SW620-vector or SW620-IRTKS cells showed oncogenesis (Figure 5D). The volume and weight of tumor produced from SW620-IRTKS cells were approximately double those produced from SW620-vector cells (Figure 5E and F). Most importantly, the in vivo experimental results are reproducible (Supplementary Figure 3). Tumor xenografts were resected and embedded in paraffin for IHC and hematoxylin and eosin (HE) assays after mice were sacrificed. These collective data demonstrated that IRTKS enhanced the tumorigenicity of CRC cells in vivo.
IRTKS regulates the phosphorylation level of AKT in CRC
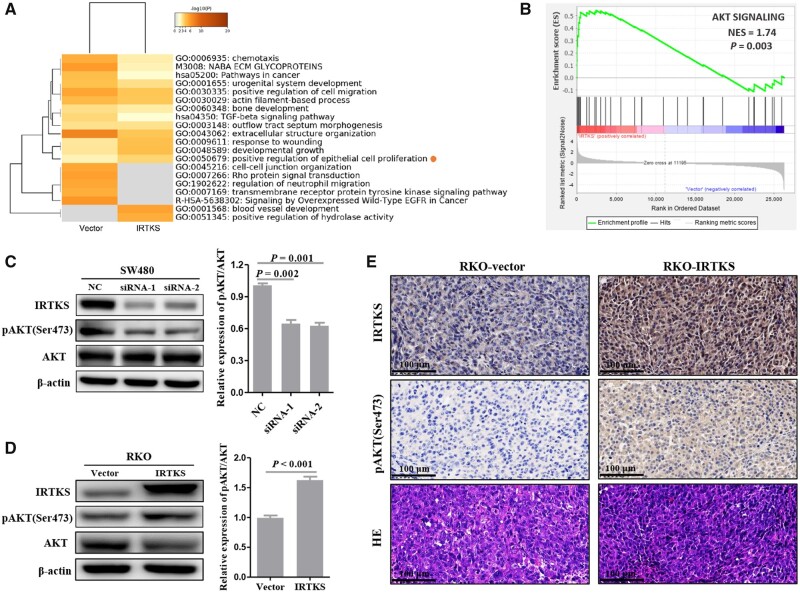
To explore the mechanism of IRTKS in CRC, differentially expressed genes between the RKO-vector and RKO-IRTKS groups were detected using the Illumina NovaSeq 6000 System. Heatmap obtained by the Metascape platform indicated that IRTKS overexpression positively regulated epithelial-cell proliferation (Figure 6A). GSEA results suggested a significant association between the AKT signaling pathway and IRTKS expression (P = 0.003) (Figure 6B).
Figure 6.
IRTKS regulates the phosphorylation level of AKT in CRC. (A) Enrichment analysis of differentially expressed genes obtained from RNA sequencing. (B) The relationship between the AKT signaling pathway and IRTKS expression. The expression of IRTKS, pAKT(Ser473), AKT, and β-actin was detected by immunoblotting after (C) IRTKS knock-down and (D) IRTKS overexpression. Histograms are the statistical results. (E) IHC-stained and HE-stained images from tumor xenograft slides of the RKO-vector group and RKO-IRTKS group (magnification, 400×; scale bar, 100 µm). NES, normalized enrichment score. NC, negative control.
An immunoblotting assay was conducted to verify the relationship between IRTKS and AKT. Using AKT as a reference, knock-down of IRTKS decreased the expression level of pAKT(Ser473) in SW480 cells (Figure 6C). Correspondingly, the expression level of pAKT(Ser473) was significantly increased in RKO cells transfected with pLVX-IRTKS (Figure 6D). IHC results from tumor xenograft slides suggested that both the histoscore of IRTKS and the histoscore of pAKT(Ser473) in the RKO-IRTKS group were higher than those in the RKO-vector group (Figure 6E).
IRTKS mediated bFGF-induced cell proliferation via phosphorylated AKT
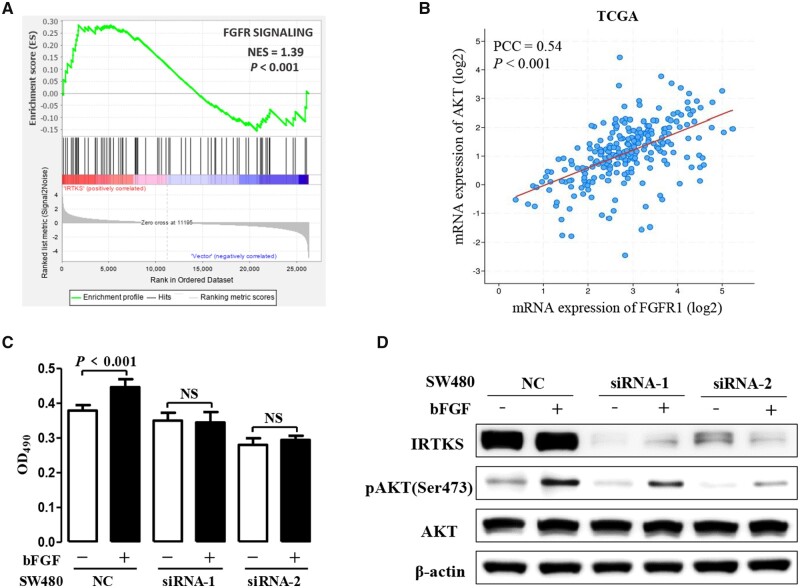
Enrichment analysis of RNA sequencing by GSEA also suggested a positive association between the fibroblast growth-factor receptor (FGFR) signaling pathway and IRTKS expression (P < 0.001) (Figure 7A). Based on the TCGA, we know that the expression level of AKT was related to the expression level of FGFR1 (Figure 7B). The expression levels of FGFR1 in 10 cell lines are shown in Supplementary Figure 4A.
Figure 7.
IRTKS mediated bFGF-induced cell proliferation via phosphorylated AKT. (A) Enrichment analysis of RNA sequencing using GSEA 4.0.1 software reveals that the FGFR signaling pathway is positively associated with the expression of IRTKS. (B) Correlation analysis of TCGA data shows that the expression of FGFR1 is positively correlated with the expression of AKT. (C) Proliferation is not detected until transfected SW480 cells were cultured in serum-free medium with or without 40 ng/mL bFGF for 48 h. (D) The effect of IRTKS knock-down on pAKT(Ser473) upregulated by bFGF was detected by immunoblotting. FGFR, fibroblast growth-factor receptor; bFGF, basic fibroblast growth factor; NES, normalized enrichment score; PCC, Pearson correlation coefficient; NC, negative control; NS, no significance.
In order to better characterize the pathogenesis of CRC promoted by IRTKS, transfected SW480 cells were cultured in serum-free medium with or without 40 ng/mL basic fibroblast growth factor (bFGF) at 37°C, 5% CO2 for 48 h. Results demonstrated that bFGF promoted cell proliferation, but this effect depended on IRTKS. When siRNA-IRTKS was transfected into SW480 cells, the promoting role of bFGF on tumor cells disappeared (Figure 7C). However, epidermal growth factor (EGF) and insulin growth factor 1 (IGF1) did not produce such effects (Supplementary Figure 4B and C).
Proteins were extracted from six types of SW480 cells (transfected with siRNA-NC with or without bFGF, transfected with siRNA-1 with or without bFGF, transfected with siRNA-2 with or without bFGF). Compared with non-stimulation, bFGF stimulation significantly increased the relative levels of pAKT(Ser473)/AKT. Moreover, both siRNA-1 and siRNA-2 reduced the difference in pAKT(Ser473) expression induced by bFGF (Figure 7D). These results confirmed that IRTKS played a vital role in the proliferation of CRC cells by regulating the bFGF/AKT signaling pathway and suggested a potential therapeutic target for CRC.
Discussion
The pathogenesis of tumors is complex, involving multiple steps and genes [15]. Recent studies revealed that many metabolism-related genes are involved in the initiation, promotion, or progression of carcinomas [16, 17]. These studies give us a deeper understanding of carcinomas. Some studies on IRTKS have focused on its functions in diseases [18, 19]. As an intracellular messenger, IRTKS participates in signal transduction, cell movement, cytoskeleton remodeling, and cell-membrane deformation [8, 9]. However, very little research has been conducted on the role of IRTKS in carcinomas and the mechanism remains unclear. Previous research was limited to the fields of the liver and the stomach, so expanding to other cancers is relevant and necessary.
Wang et al. [13] found that the expression of IRTKS in hepatocellular cancer was significantly upregulated and closely related to tumor volume. They believed that upregulated IRTKS could induce hepatoma cells into the S phase of the cell cycle through the EGFR/ERK signaling pathway, thus promoting tumor growth. This was different from the viewpoint in the field of gastric cancer. Huang et al. [14] believed that IRTKS overexpression was negatively correlated with the prognosis and overall survival time of patients with gastric cancer with wild-type p53 through the promotion of p53 degradation via the ubiquitin/proteasome pathway.
In the current study, our results indicated that the expression of IRTKS in carcinoma tissues was significantly higher than that in normal tissues. Moreover, we confirmed that the expression of IRTKS was associated with the prognosis of patients with CRC. In order to understand these correlations, experiments were conducted in vitro and in vivo. Results demonstrated that IRTKS promoted the proliferation by activating AKT. Activated AKT stimulates growth and increases proliferation, which is tightly controlled and dependent on extracellular growth signals [20]. Wu et al. [21] considered that IRTKS enhanced the phosphorylation of AKT partially due to inhibiting SHIP2 activity in hepatocellular carcinoma. However, no significant correlation was found between IRTKS and SHIP2 in CRC by analysing our data and the TCGA database. The enhancement of the AKT signaling pathway has been demonstrated in various forms of cancers, especially in CRC [22]. Due to their significant roles in colorectal carcinogenesis, molecules involved in this pathway are often recognized as striking therapeutic targets [23] and IRTKS may be an effective one.
As an activator of the FGFR signaling pathway, fibroblast growth factor (FGF) activates downstream signals by binding to the extracellular segment of the FGFR. Many studies indicated that members of the FGF family and their receptors play important roles in CRC. For example, Li et al. [24] demonstrated that tumor-derived-activated FGFR2 induced PD-L1 expression via the JAK/STAT3 signaling pathway in CRC, which induced the apoptosis of Jurkat T-cells; Otte et al. [25] found that bFGF played important roles in the oncogenesis and resistance of CRC by maintaining the self-renewal of cancer stem cells. This study demonstrated that bFGF could promote the proliferation of cancer cells and the phosphorylation of AKT. We also uncovered that bFGF-induced cell proliferation and AKT phosphorylation can be inhibited by siRNA-IRTKS.
The limitation of our study is that the control cell lines used in the in vitro cell-line experiments are suboptimal. Normal colon organoids or primary colon epithelial cells are widely regarded as ideal controls for CRC cell lines. In conclusion, IRTKS mediated bFGF-induced cell proliferation through the phosphorylation of AKT in CRC cells, which may contribute to tumorigenicity in vivo. Our findings provide a new insight into understanding the molecular mechanism of CRC and the value of IRTKS in diagnosis and treatment will no doubt be the focus of future studies.
Supplementary data
Supplementary data is available at Gastroenterology Report online.
Authors' contributions
S.W., Z.L., and X.S.W. conceived and designed the project. Y.M.M/, E.R.L., and Y.K.Z. performed the experiments and collected the data, while X.G., Z.J., and P.S. analysed and interpreted the data. S.W., H.Y.W., and X.S.W. drafted the manuscript. All authors read and approved the final manuscript.
Funding
This work was supported by the National Program Project for Precision Medicine in National Research and Development Plan of China [No. 2016YFC0905300], National Natural Science Foundation of China [No. 81572930], National Key Research and Development Program of the Ministry of Science and Technology of China [No. 2016YFC0905303], and Beijing Science and Technology Program [No. D171100002617004].
Conflicts of interest
None declared.
Supplementary Material
References
- 1. Siegel RL, Miller KD, Jemal A.. Cancer statistics, 2018. CA Cancer J Clin 2018;68:7–30. [DOI] [PubMed] [Google Scholar]
- 2. Chen W, Zheng R, Baade PD. et al. Cancer statistics in China, 2015. CA Cancer J Clin 2016;66:115–32. [DOI] [PubMed] [Google Scholar]
- 3. Yamamoto M, Inohara H, Nakagawa T.. Targeting metabolic pathways for head and neck cancers therapeutics. Cancer Metastasis Rev 2017;36:503–14. [DOI] [PubMed] [Google Scholar]
- 4. Oleinik NV, Krupenko NI, Krupenko SA.. Epigenetic silencing of ALDH1L1, a metabolic regulator of cellular proliferation, in cancers. Genes Cancer 2011;2:130–9. [DOI] [PMC free article] [PubMed] [Google Scholar]
- 5. Price DK, Chau CH, Till C. et al. Association of androgen metabolism gene polymorphisms with prostate cancer risk and androgen concentrations: results from the Prostate Cancer Prevention Trial. Cancer 2016;122:2332–40. [DOI] [PMC free article] [PubMed] [Google Scholar]
- 6. Yeh TC, Ogawa W, Danielsen AG. et al. Characterization and cloning of a 58/53-kDa substrate of the insulin receptor tyrosine kinase. J Biol Chem 1996;271:2921–8. [DOI] [PubMed] [Google Scholar]
- 7. Hu RM, Han ZG, Song HD. et al. Gene expression profiling in the human hypothalamus-pituitary-adrenal axis and full-length cDNA cloning. Proc Natl Acad Sci USA 2000;97:9543–8. [DOI] [PMC free article] [PubMed] [Google Scholar]
- 8. Scita G, Confalonieri S, Lappalainen P. et al. IRSp53: crossing the road of membrane and actin dynamics in the formation of membrane protrusions. Trends Cell Biol 2008;18:52–60. [DOI] [PubMed] [Google Scholar]
- 9. Yamagishi A, Masuda M, Ohki T. et al. A novel actin bundling/filopodium-forming domain conserved in insulin receptor tyrosine kinase substrate p53 and missing in metastasis protein. J Biol Chem 2004;279:14929–36. [DOI] [PubMed] [Google Scholar]
- 10. Hubbard SR. The insulin receptor: both a prototypical and atypical receptor tyrosine kinase. Cold Spring Harb Perspect Biol 2013;5:a008946–a008946. [DOI] [PMC free article] [PubMed] [Google Scholar]
- 11. Wang KS, Chen G, Shen HL. et al. Insulin receptor tyrosine kinase substrate enhances low levels of MDM2-mediated p53 ubiquitination. PLoS One 2011;6:e23571. [DOI] [PMC free article] [PubMed] [Google Scholar]
- 12. Huang LY, Wang YP, Wei BF. et al. Deficiency of IRTKS as an adaptor of insulin receptor leads to insulin resistance. Cell Res 2013;23:1310–21. [DOI] [PMC free article] [PubMed] [Google Scholar]
- 13. Wang YP, Huang LY, Sun WM. et al. Insulin receptor tyrosine kinase substrate activates EGFR/ERK signalling pathway and promotes cell proliferation of hepatocellular carcinoma. Cancer Lett 2013;337:96–106. [DOI] [PubMed] [Google Scholar]
- 14. Huang LY, Wang X, Cui XF. et al. IRTKS is correlated with progression and survival time of patients with gastric cancer. Gut 2018;67:1400–9. [DOI] [PubMed] [Google Scholar]
- 15. McGranahan N, Swanton C.. Clonal heterogeneity and tumor evolution: past, present, and the future. Cell 2017;168:613–28. [DOI] [PubMed] [Google Scholar]
- 16. Hanahan D, Weinberg RA.. The Hallmarks of Cancer. Cell 2000;100:57–70. [DOI] [PubMed] [Google Scholar]
- 17. Garraway LA, Lander ES.. Lessons from the cancer genome. Cell 2013;153:17–37. [DOI] [PubMed] [Google Scholar]
- 18. Postema MM, Grega-Larson NE, Neininger AC. et al. IRTKS (BAIAP2L1) elongates epithelial microvilli using EPS8-dependent and independent mechanisms. Curr Biol 2018;28:2876–88. [DOI] [PMC free article] [PubMed] [Google Scholar]
- 19. Chen G, Li T, Zhang L. et al. Src-stimulated IRTKS phosphorylation enhances cell migration. FEBS Lett 2011;585:2972–8. [DOI] [PubMed] [Google Scholar]
- 20. Danielsen SA, Eide PW, Nesbakken A. et al. Portrait of the PI3K/AKT pathway in colorectal cancer. Biochim Biophys Acta 2015;1855:104–21. [DOI] [PubMed] [Google Scholar]
- 21. Wu CC, Cui XF, Huang LY. et al. IRTKS promotes insulin signaling transduction through inhibiting SHIP2 phosphatase activity. IJMS 2019;20:2834. [DOI] [PMC free article] [PubMed] [Google Scholar]
- 22. Narayanankutty A. PI3K/ Akt/ mTOR pathway as a therapeutic target for colorectal cancer: a review of preclinical and clinical evidence. Curr Drug Targets 2019;20:1217–26. [DOI] [PubMed] [Google Scholar]
- 23. Ma J, Sun X, Wang Y. et al. Fibroblast-derived CXCL12 regulates PTEN expression and is associated with the proliferation and invasion of colon cancer cells via PI3k/Akt signaling. Cell Commun Signal 2019;17:119. [DOI] [PMC free article] [PubMed] [Google Scholar]
- 24. Li P, Huang T, Zou Q. et al. FGFR2 promotes expression of PD-L1 in colorectal cancer via the JAK/STAT3 signaling pathway. J Immunol 2019;202:3065–75. [DOI] [PubMed] [Google Scholar]
- 25. Otte J, Dizdar L, Behrens B. et al. FGF signalling in the self-renewal of colon cancer organoids. Sci Rep 2019;9:17365. [DOI] [PMC free article] [PubMed] [Google Scholar]
Associated Data
This section collects any data citations, data availability statements, or supplementary materials included in this article.


