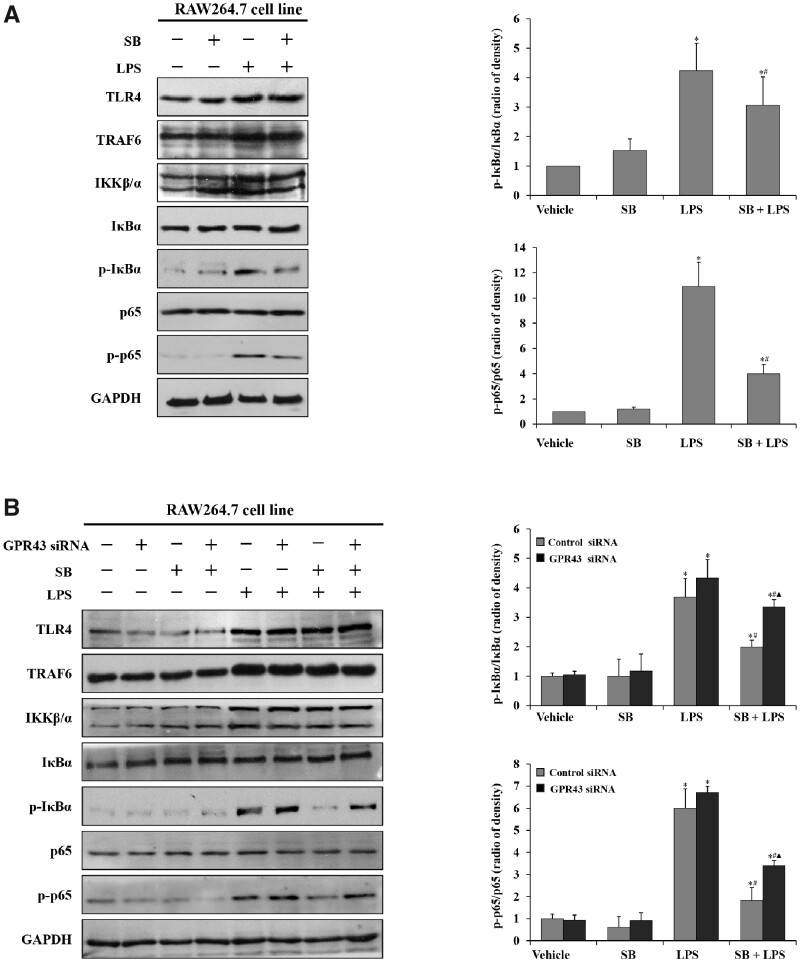
Figure 4.
Sodium butyrate/GPR43 signaling repressed macrophage activity via regulating TLR4/NF-κB p65 networks. (A) Expression of TLR4, TRAF6, IKKβ/α, phospho-IκBα, IκBα, phospho-p65, and p65 in RAW264.7 cells was detected by Western blot. Levels of GAPDH are shown as a loading control; relative quantitative evaluation of the Western-blot analysis for phospho-IκBα/IκBα, phospho-p65/p65 expression was obtained using Image-Pro Plus6.0 software. *P < 0.05 vs vehicle group; #P < 0.05 vs LPS group. Values are expressed as mean ± SD (n = 6 per group). (B) Expression of TLR4, TRAF6, IKKβ/α, phospho-IκBα, IκBα, phospho-p65, and p65 in RAW264.7 cells that were transfected with GPR43 siRNA RNA oligo (GPR43 siRNA) or control siRNA RNA oligo (control siRNA) was detected by Western blot. Levels of GAPDH are shown as a loading control; relative quantitative evaluation of the Western-blot analysis for (phospho-IκBα/GAPDH)/(IκBα/GAPDH), (phospho-p65/GAPDH)/(p65/GAPDH) expression was obtained using Image-Pro Plus6.0 software. *P < 0.05 vs vehicle control group in the same type of cell; #P < 0.05 vs LPS group in the same type of cell; ▲ P < 0.05 vs SB + LPS group in the control siRNA group. Values are expressed as mean ± SD (n = 6 per group). SB, sodium butyrate.

