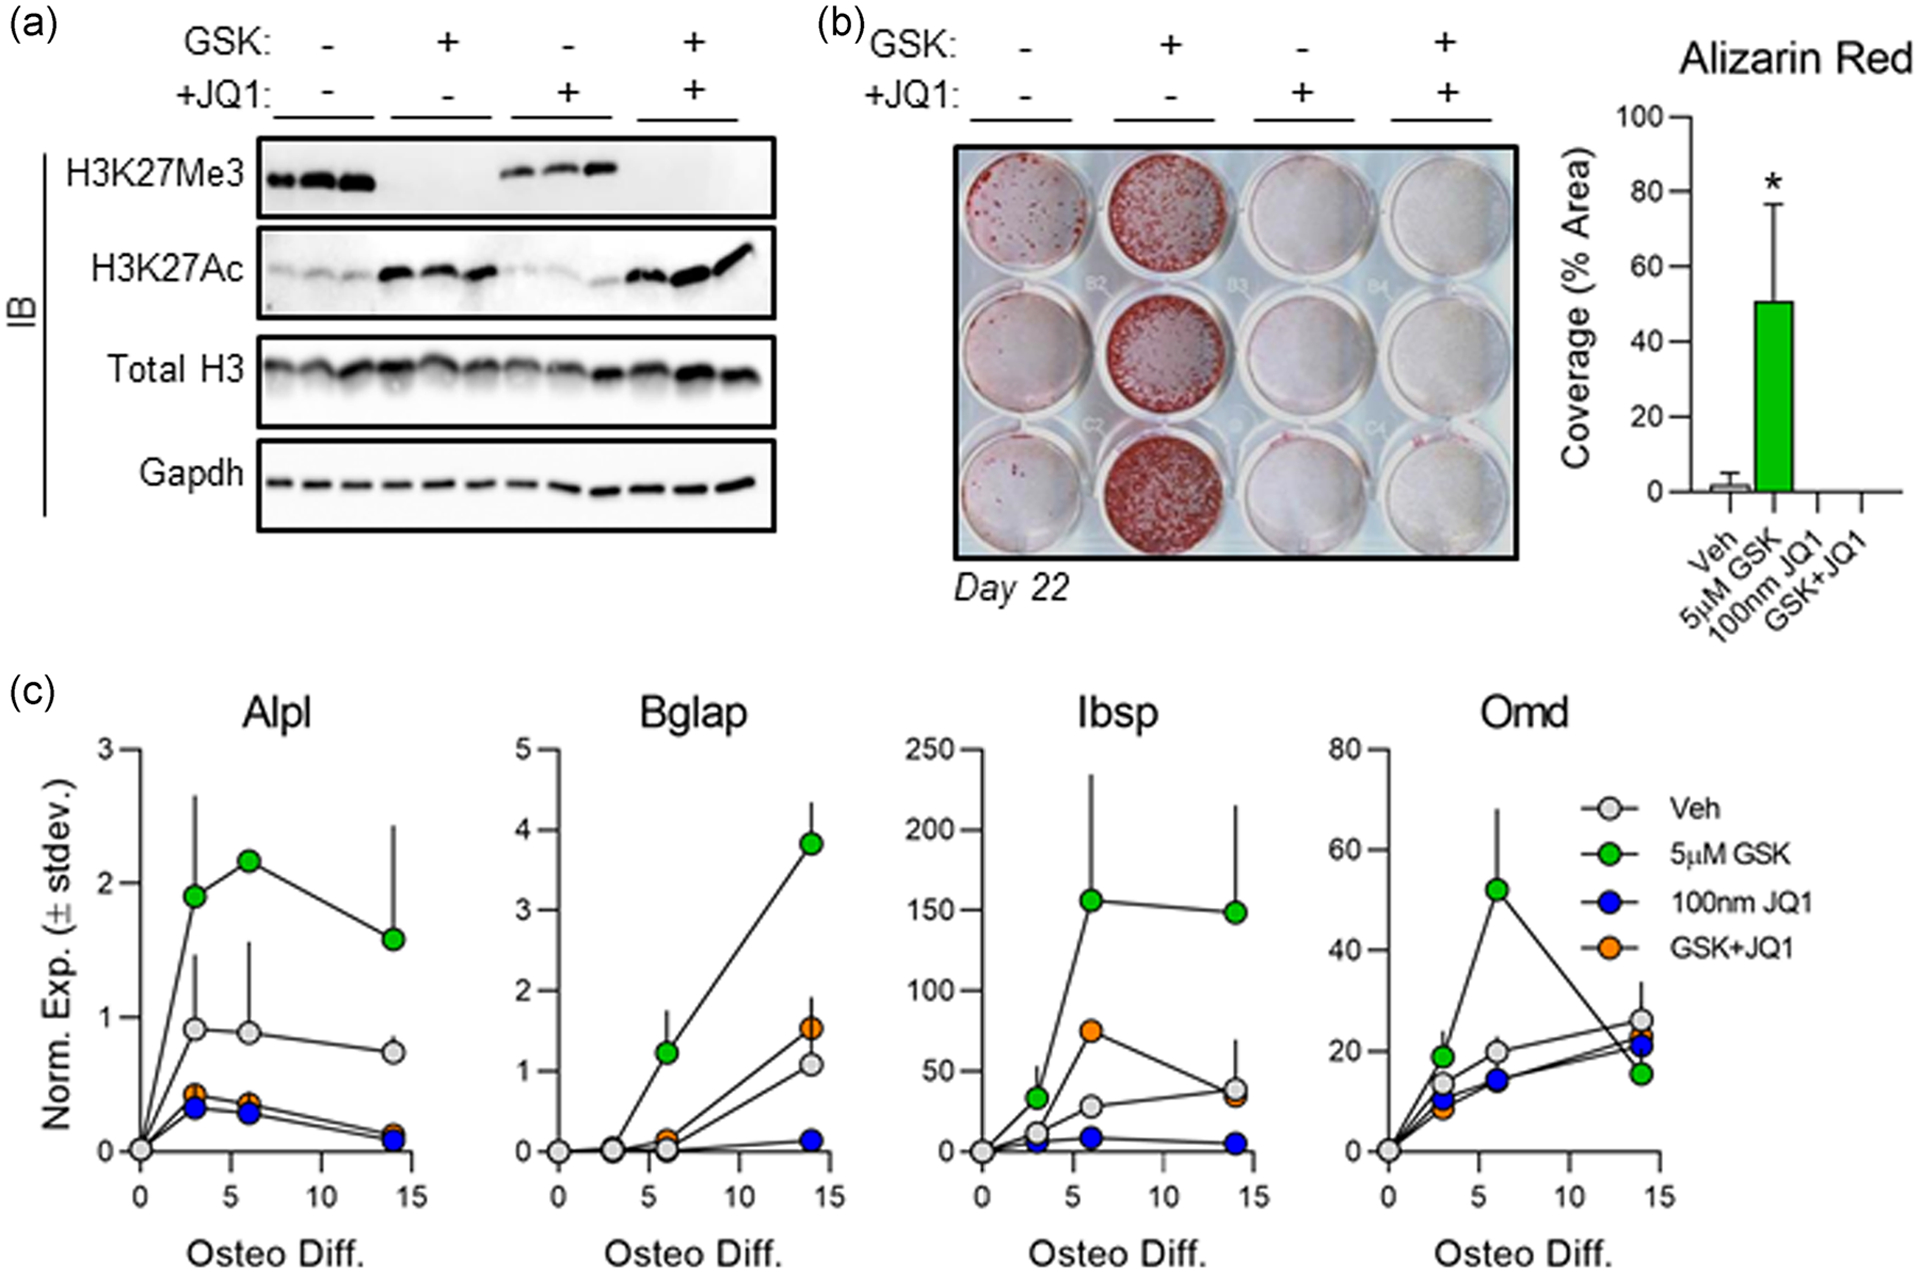
FIGURE 6.

Brd4 inhibition negates the pro-osteogenic effects of Ezh2 inhibition. Subconfluent MC3T3s were treated with 5 μM GSK126 and/or 100 nM +JQ1 for the first 3 days of osteogenic differentiation. (a) Western blot analysis of protein lysates collected on day three. (b) Alizarin red staining (left) and quantification (right) conducted on Day 22 of osteogenic differentiation (n = 3, mean ± STD). (c) Quantitative reverse transcription polymerase chain reaction (RT-qPCR) analysis performed on messenger RNA (mRNA) collected throughout the osteogenic differentiation time course for each treatment group (n = 3, mean ± STD). All error bars represent ± STD of three biological replicates. Statistical significance to vehicle (DMSO) control group indicated as follows: *p < .01
