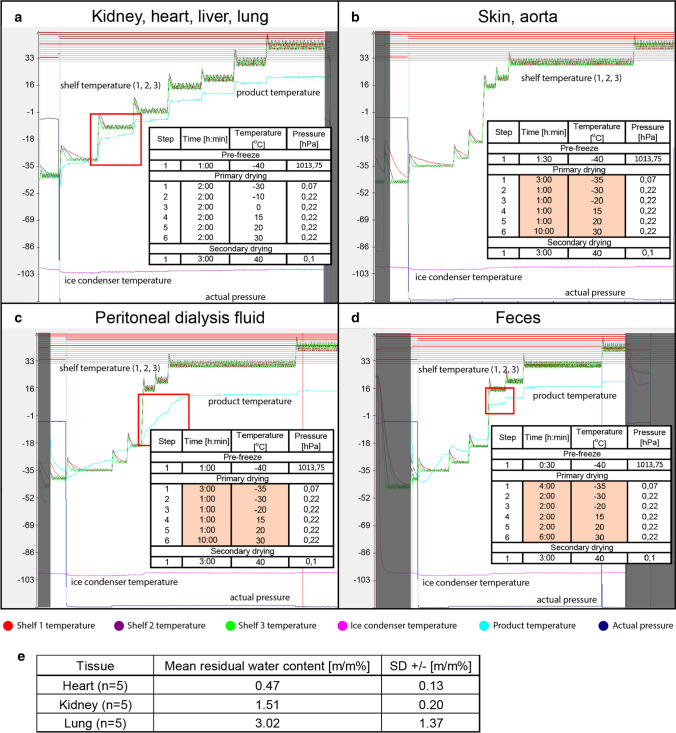
Fig. 3.
Protocols for lyophilization and their efficacy for various samples. Representative graphs and reference protocols with exact time, temperature, and pressure values indicated for each phase used for: a kidney, heart, liver, and lung tissue samples; b aorta and skin tissue samples; c peritoneal dialysis fluid concentration; d liquid removal from fecal samples. Red frames on representative graphs indicate the ice sublimation around the sensor when measured product temperature approaches shelf temperature. e Result of residual water content measurement of some limited tissue samples by Karl Fischer titration

