
Fig. 1. Simulated prevalence of symptomatic infections.
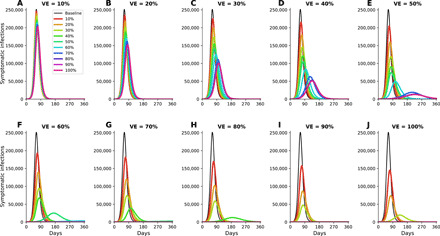
Simulated prevalence of symptomatic COVID-19 infections for VE ranging from 10% (A) to 100% (J) in 10% increments. For each VE and each vaccination coverage, the optimal vaccine allocation for minimizing symptomatic infections was used in these simulations. Colors represent different vaccination coverage, ranging from 0% (black, “baseline”) to 100% (magenta). For clarity, we present here epidemic curves for the main set of parameters only and show a complete figure with uncertainty bounds in fig. S2.