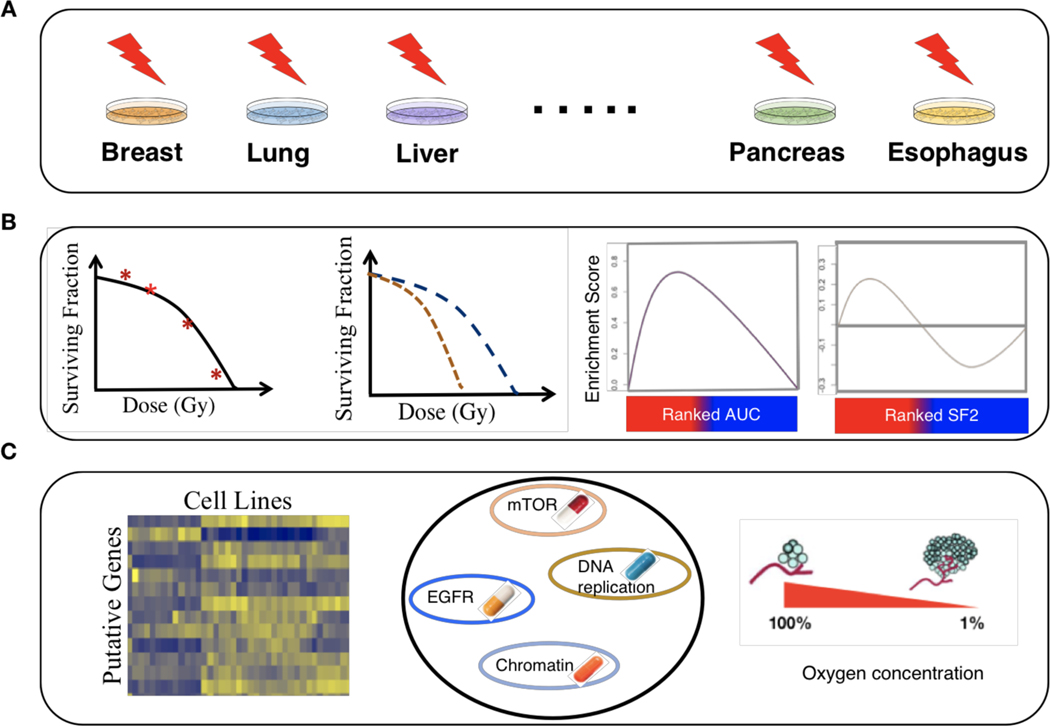
Figure 1: An overview of pre-clinical assessment of radiosensitivity using dose-response and molecular profiling data.
(A) A schematic illustrating data collection, curation, processing of radiogenomic data obtained from cancer cell lines of diverse histologies. (B) A schematic illustrating the process of radiobiological modeling using the linear-quadratic model, assessing the consistency of dose-response data across assays, and evaluating distinct radiation sensitivity indicators such as area under the survival curve (AUC) and surviving fraction after 2 Gy (SF2). (C) A schematic illustrating integrative analysis of modeled radioresponse from distinct cell lines with associated genomic/transcriptomic data, pharmacogenomic data, and hypoxia modeling.

