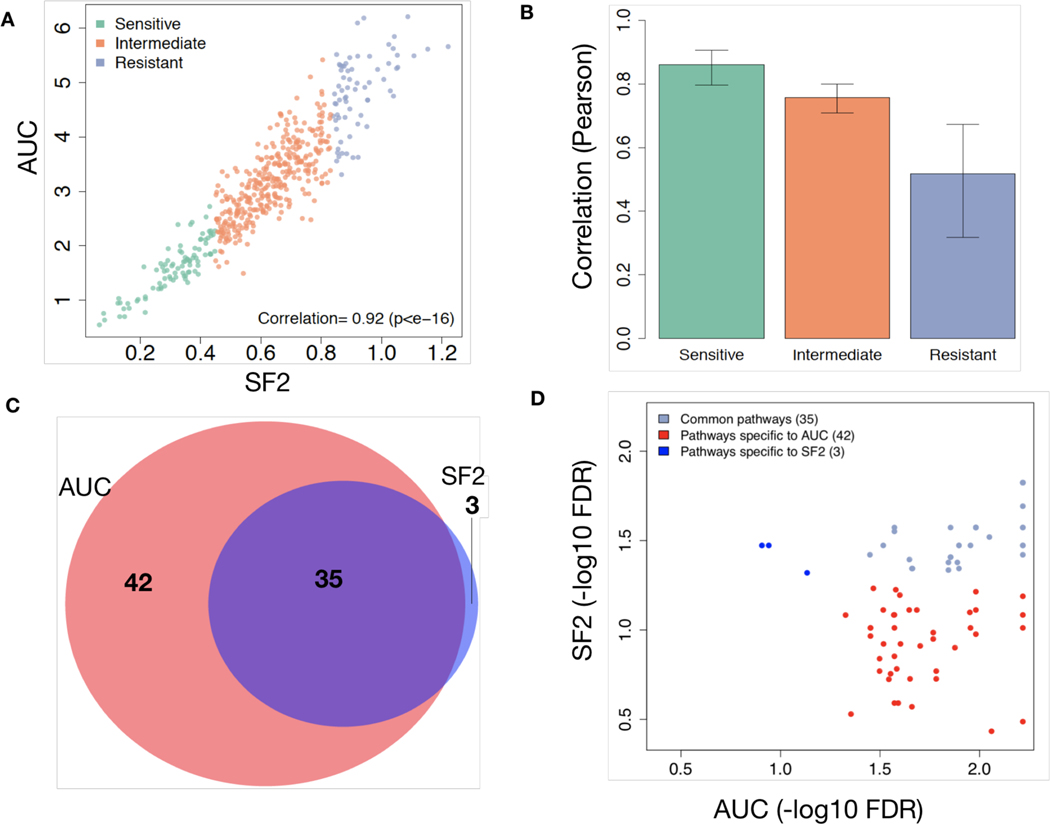
Figure 3: Concordance of SF2 and AUC.
(A) Correlation between the radioresponse indicators, SF2 and AUC, across 498 cell lines. (B) Pearson correlation (with standard deviation) between SF2 and AUC across 498 cell lines based on tertiles. (C) Venn diagram illustrating the transcriptional pathways associated with radioresponse using SF2 or AUC as the response indicator. (D) False discovery rate (FDR) for each transcriptional pathway from (C) illustrating greater levels of statistical significance among pathways specific to AUC.

