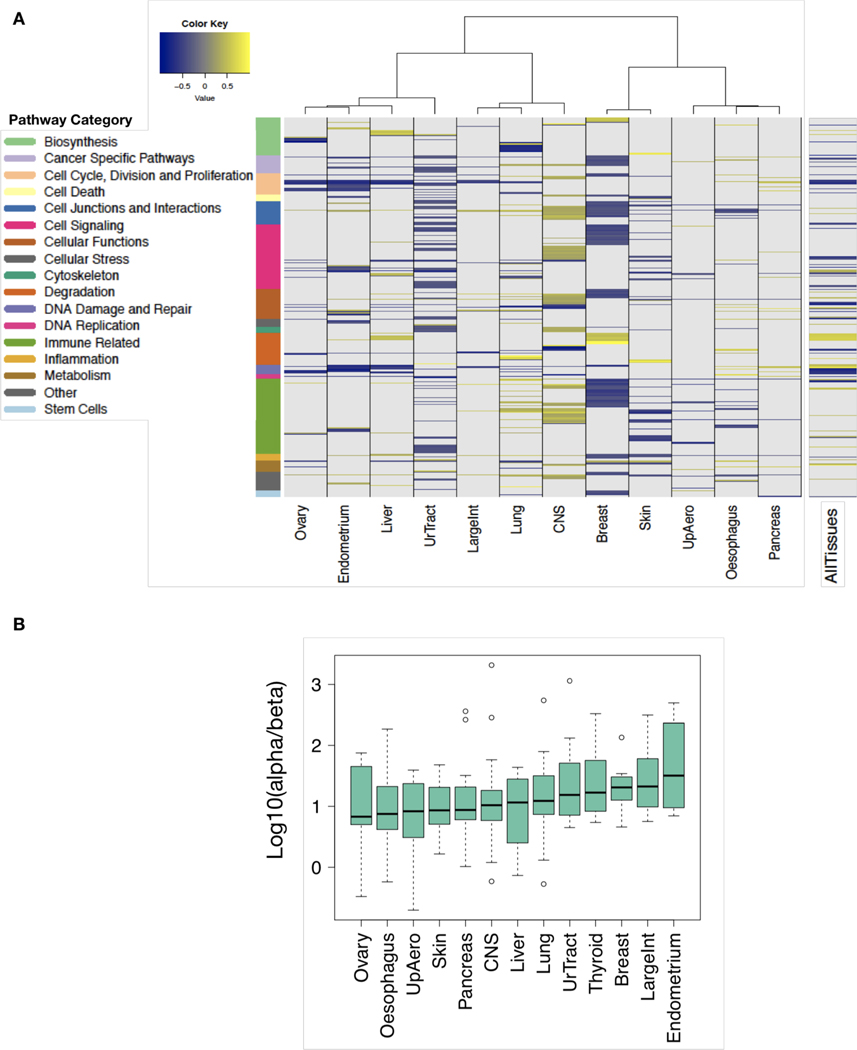
Figure 6: Tissue specificity of molecular determinants of radioresponse.
(A) The tissue types (columns) represented by a minimum of 15 cancer cell lines were considered for analysis. A total of 281 pathways are depicted (rows) and are annotated by function. Colours designate pathways significantly associated with AUC (FDR < 5%). (B) Heterogeneity of α/β ratios across cancer cell lines derived from distinct tissue types ordered according to median values.

