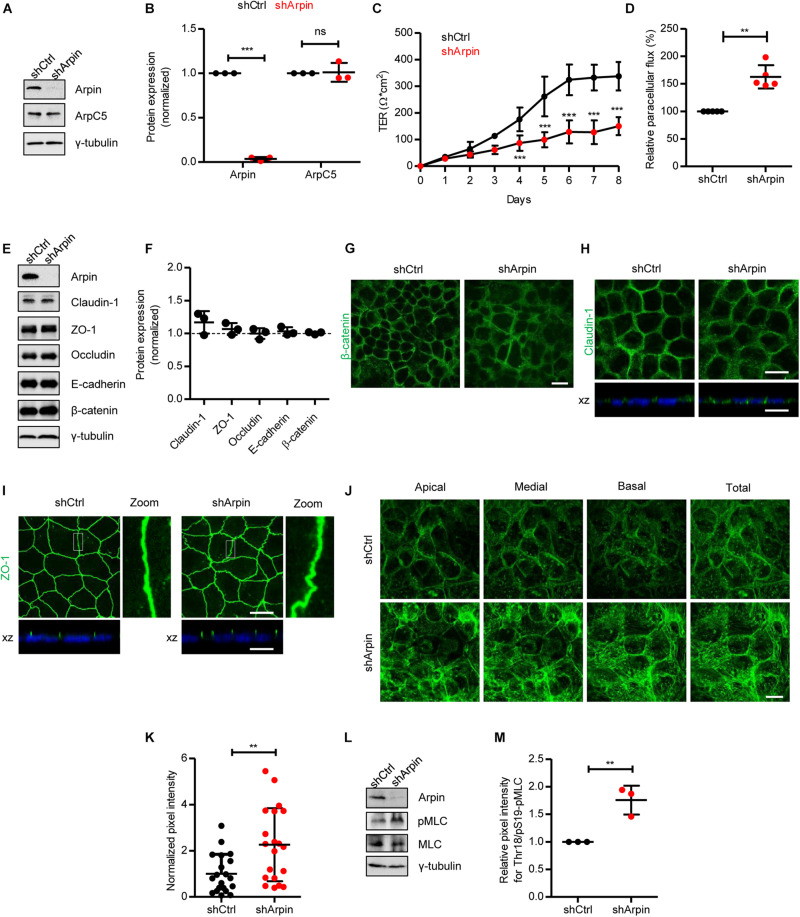
FIGURE 2.
Arpin depletion causes hyperpermeability and altered architecture of junctions and the actin cytoskeleton. (A) Western blot for arpin and ArpC5 of lysates from control (shCtrl) and arpin-depleted (shArpin) Caco-2 cells. (B) Densitometric analysis of panel (A) (n = 3; two-tailed t-test). (C) Transepithelial electrical resistance (TER) development in control and arpin-depleted Caco-2 monolayers (n = 6; two-way ANOVA with Bonferroni‘s correction). (D) Paracellular flux using confluent control and arpin-depleted Caco-2 monolayers (n = 3; two-tailed t-test). (E) Western blot for claudin-1, zonula occludens 1 (ZO-1), occludin, E-cadherin, and β-catenin in control and arpin-depleted cells. (F) Densitometric analysis of panel E (n = 3; two-tailed t-test). (G) Immunostaining for β-catenin (green) in control and arpin-depleted Caco-2 monolayers (n = 3). Bar = 20 μm. (H) Immunostaining for claudin-1 in control and arpin-depleted Caco-2 monolayers. xz-planes are shown below for claudin-1 (green) and the nuclei as reference (blue). Images are representative of n = 3. Bar = 20 μm. (I) Immunostaining for ZO-1 (green) in control and arpin-depleted Caco-2 monolayers. xz-planes are shown below with nuclei as reference (blue); n = 3. 3 × digital zoom of junctions is shown on the right. Bar = 20 μm. (J) Location of apical, medial, and basal actin filaments in control and arpin-depleted Caco-2 cells stained with phalloidin; n = 4. Bar = 20 μm. (K) Actin density quantification normalized to the average of shCtrl cells (n = 20 cells per condition randomly selected from four independent experiments, two-tailed t-test). (L) Western blot for myosin-II light chain (MLC) and pMLC in control and arpin-depleted cells. (M) Densitometric analysis of panel (L) (n = 3; two-tailed t-test). **p < 0.01; ***p < 0.01. ns = not significant.

