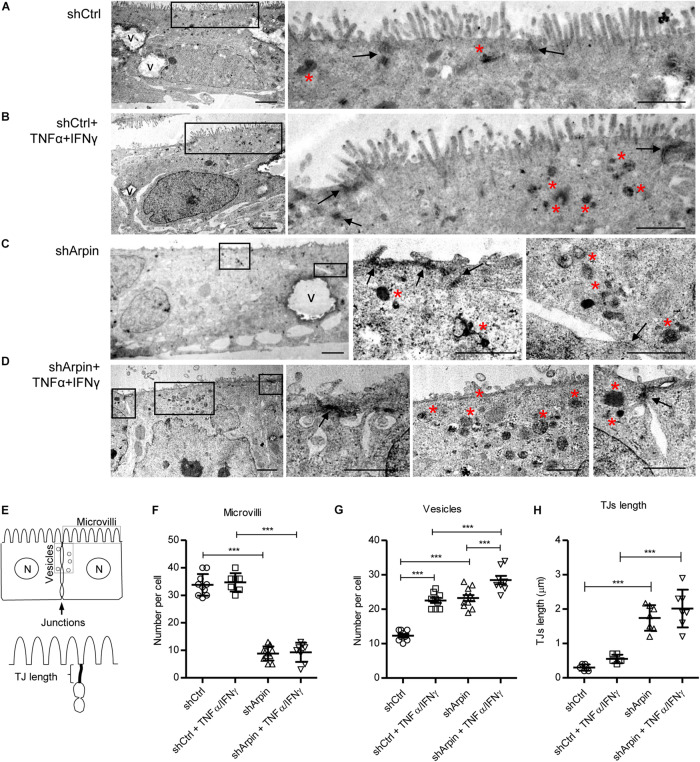
FIGURE 3.
Arpin depletion alters the ultrastructure of intestinal epithelial cells. Morphology of resting (A) and tumor necrosis factor (TNF)α/interferon (IFN)γ-treated (B) control cells (shCtrl). Morphology of resting (C) and TNFα/IFNγ-treated (D) arpin-depleted cells (shArpin). In the low-magnification micrographs on the left, overall morphology of entire epithelial cells can be observed (V, vacuoles; bar = 2 μm). Frames indicate areas from which the high-magnification images (on the right) were taken. Arrows indicate tight junctions at the apical-most cell contacts. Red asterisks indicate accumulation of electron-dense endocytic vesicle (right images, bar = 1 μm). (E) Scheme of the method for quantification of the number of microvilli, vesicles, and tight junction (TJ) length. Panels (F–H) correspond to the quantification of number of microvilli, number of vesicles, and TJ length, respectively (n = 6–11; one-way ANOVA with post hoc Tukey test). ***p < 0.001.

