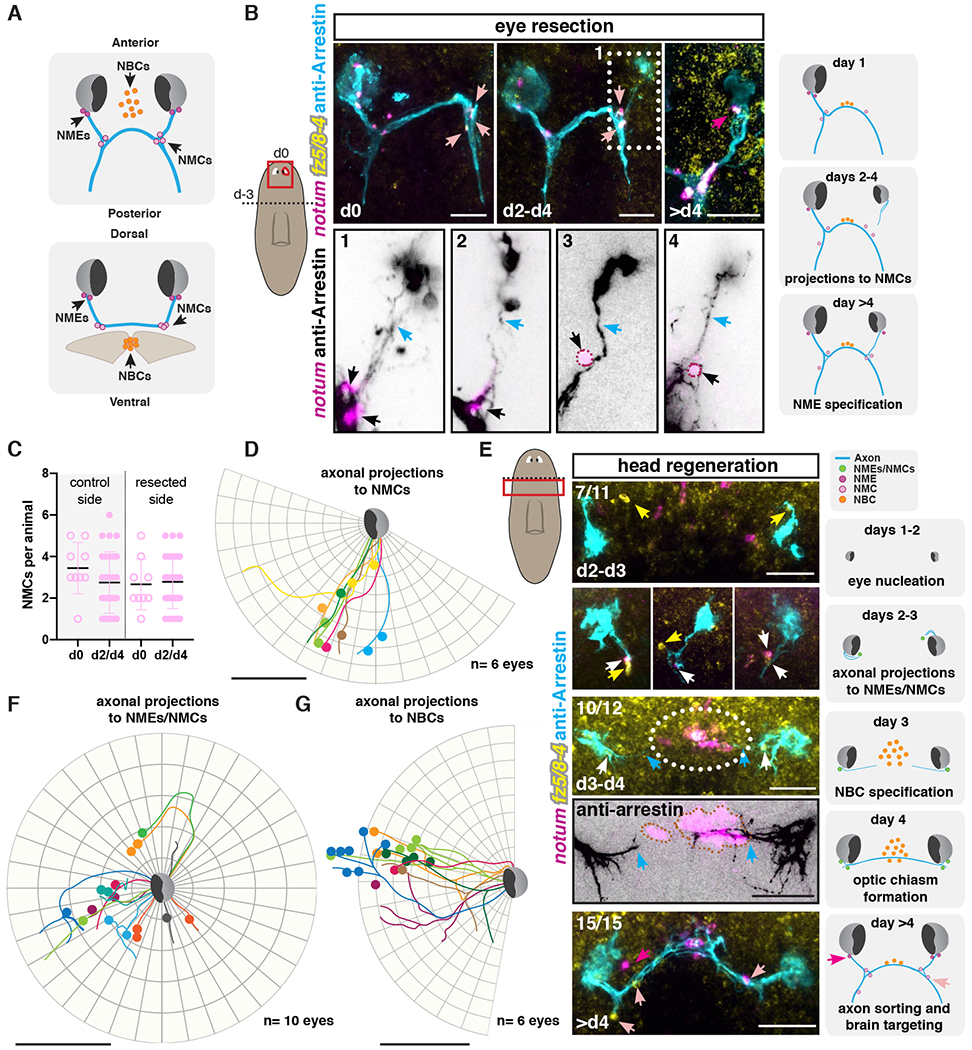
Figure 2. notum+ fz5/8-4+ muscle cells are associated with regenerating visual axons.

(A) Illustrations show NME, NMC, and NBC positions across different axes. (B) Regeneration of visual system at different timepoints following unilateral eye resection. Bottom: zoom-ins of visual axonal projection examples (1-4) 2-4 days after eye resection. Dotted outline, NMEs/NMCs. Left cartoon shows surgical procedure: head decapitation (dotted line; day −3) and unilateral eye resection three days later (d0; red line). Red box, location of image taken. Right cartoons summarize events observed following eye resection. (C) Graph shows no change in NMC numbers between resected and control sides. (D, F, G) Circular plots show tracing of photoreceptor axonal trajectories (lines) from independent right eyes during regeneration (d2 to d4) of a resected eye (D) or decapitation (F, G). Colored dots represent NMCs (D), NMEs/NMCs (F) or NBCs (G). (E) Regenerating visual system following decapitation. Dotted line in left cartoon indicates amputation line, red box shows location of image taken. Illustrations (right) summarize events observed after decapitation. Blue arrows, axons; white arrows, NMEs and/or NMCs, dark pink arrows or dots, NMEs; light pink arrows or dots and black arrows, NMCs. Orange dots or dotted outline, NBCs; white arrows, NMEs/NMCs; yellow arrows NMEs/NMCs expressing only frizzled 5/8-4.
Scale bars, 50μm (B, D-G).
