Figure 6.

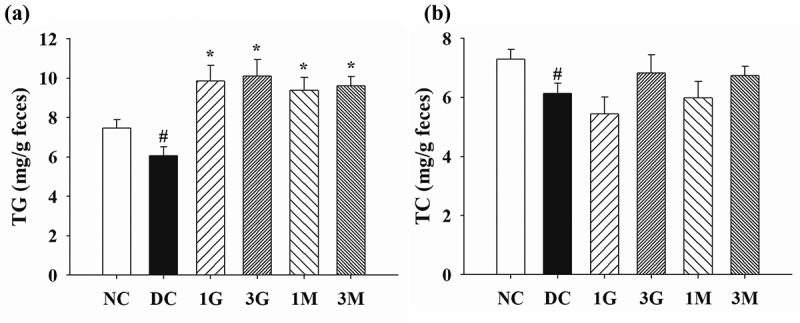
The levels of (a) triglyceride (TG) and (b) total cholesterol (TC) in the faeces of rats fed with G. lucidum supplement high-cholesterol diets
After treatment of G. lucidum supplement diets for 5 weeks, the faecal samples were collected individually for the detection of TG and TC concentrations as described in Materials and methods. Results are expressed as mean ± SEM for each group of rats (n = 8). #p < 0.05 compared with the normal control (NC); *p < 0.05 compared with diabetic control (DC).
