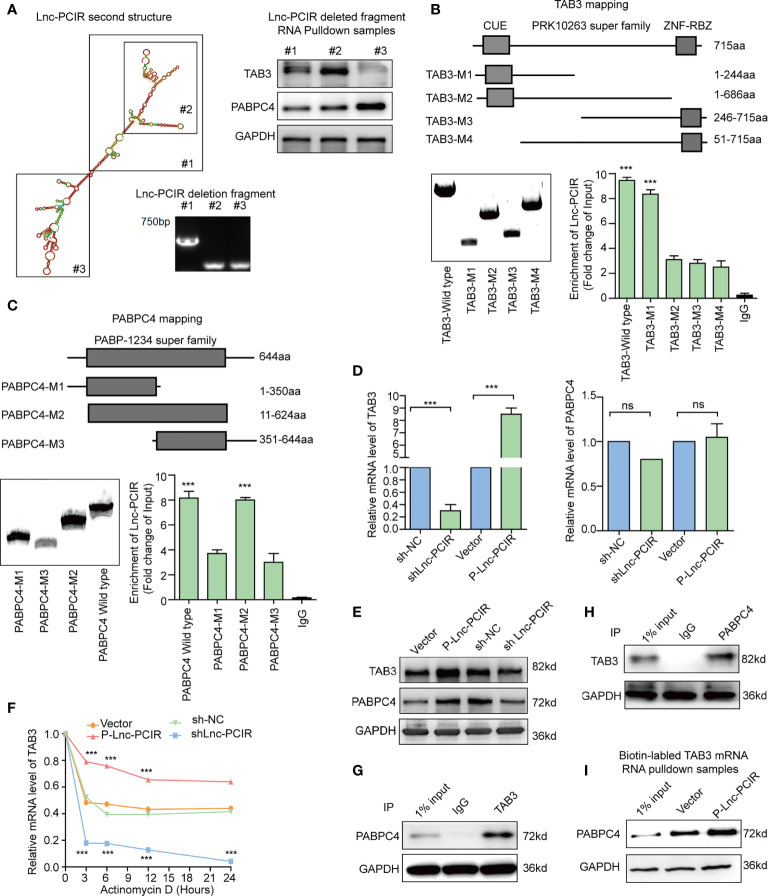
Figure 6.
Lnc-PCIR enhances the protein levels of TAB3 and PABPC4. (A) Deletion mapping of the Lnc-PCIR according to the second structure (https://lncipedia.org/); Western blot of TAB3 or PABPC4 in pull-down samples by full-length biotinylated-Lnc-PCIR or truncated biotinylated- Lnc-PCIR RNA motifs, with GAPDH as the negative control; (B, C) RIP analysis of deletion mapping for the domains of TAB3 (B) or PABPC4 (C) that bind to Lnc-PCIR; (D) The mRNA levels of TAB3 or PABPC4 were quantified by qRT-PCR with Lnc-PCIR knockdown or overexpression; (E) The protein levels of TAB3 or PABPC4 after Lnc-PCIR overexpression or knockdown. GAPDH served as the internal control; (F) The half-life of TAB3 after treatment with actinomycin D for indicated times, with Lnc-PCIR knockdown or overexpression; (G, H) Co-IP assay to detect the association between TAB3 and PABPC4; (I) Western blot to analysis the interaction of PABPC4 with biotinylated-TAB3 mRNA using RNA pull-down samples in 231 cell lines. All p-values calculated by independent sample t-test (***significant values of <0.001). ns, no significance.

