. 2020 Nov 24;298(2):319–329. doi: 10.1148/radiol.2020201640

Figure 3:

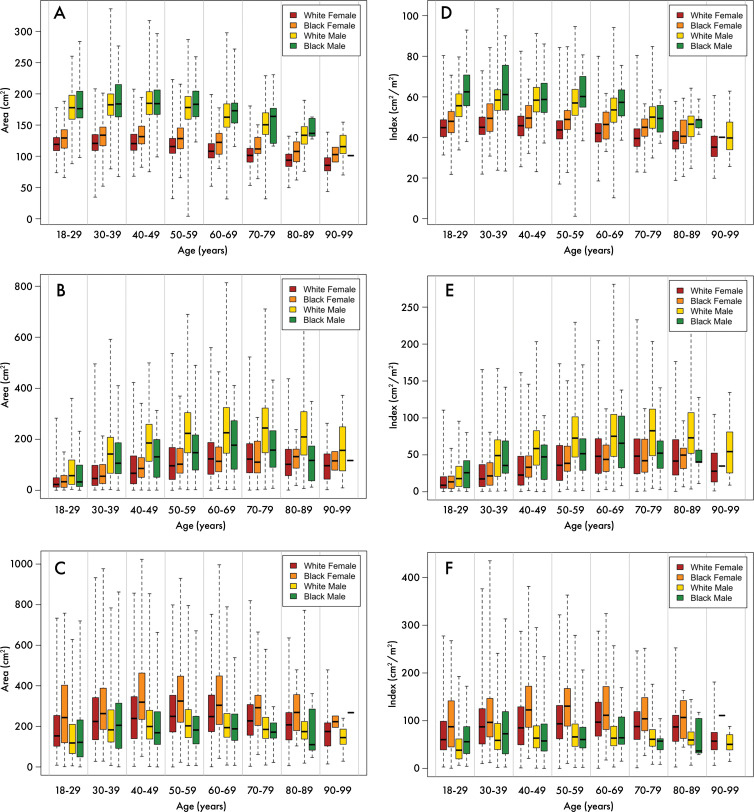
Distribution of body composition parameters according to race and sex. Box-and-whisker plots show, A, skeletal muscle area, B, visceral fat area, C, subcutaneous fat area, D, skeletal muscle index, E, visceral fat index, and, F, subcutaneous fat index in outpatient population in White non-Hispanic women (red), Black women (orange), White non-Hispanic men (yellow), and Black men (green). Line within box represents the median, box represents interquartile range, and dashed lines represent maximum and minimum values in our population.

Distribution of body composition parameters according to race and sex. Box-and-whisker plots show, A, skeletal muscle area, B, visceral fat area, C, subcutaneous fat area, D, skeletal muscle index, E, visceral fat index, and, F, subcutaneous fat index in outpatient population in White non-Hispanic women (red), Black women (orange), White non-Hispanic men (yellow), and Black men (green). Line within box represents the median, box represents interquartile range, and dashed lines represent maximum and minimum values in our population.