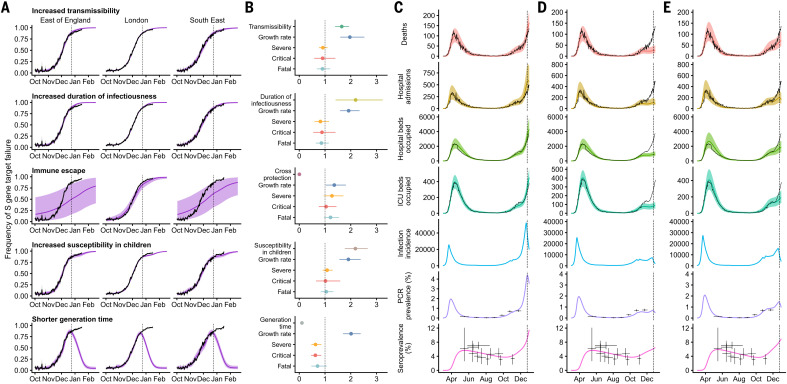
Fig. 3. Comparison of possible biological mechanisms underlying the rapid spread of VOC 202012/01.
Each row shows a different assumed mechanism. (A) Relative frequency of VOC 202012/01 (black line and ribbon respectively denote observed S gene target failure frequency with 95% binomial credible interval; purple line and ribbon respectively denote mean and 95% credible interval from model fit). (B) Posterior estimates (mean and 95% credible intervals) for relative odds of hospitalization (severe illness), relative odds of ICU admission (critical illness), relative odds of death (fatal illness), growth rate as a multiplicative factor per week [i.e., exp(7·∆r)], and the parameter that defines the hypothesized mechanism; all parameters are relative to those estimated for preexisting variants. (C to E) Illustrative model fits for the South East NHS England region: (C) fitted two-strain increased transmissibility model with VOC 202012/01 included; (D) fitted two-strain increased transmissibility model with VOC 202012/01 removed; (E) fitted single-strain model without emergence of VOC 202012/01. Black lines denote observed data; error bars denote the date range and 95% credible intervals for observed PCR prevalence and seroprevalence; colored lines and ribbons denote median and 95% credible intervals from model fit.

