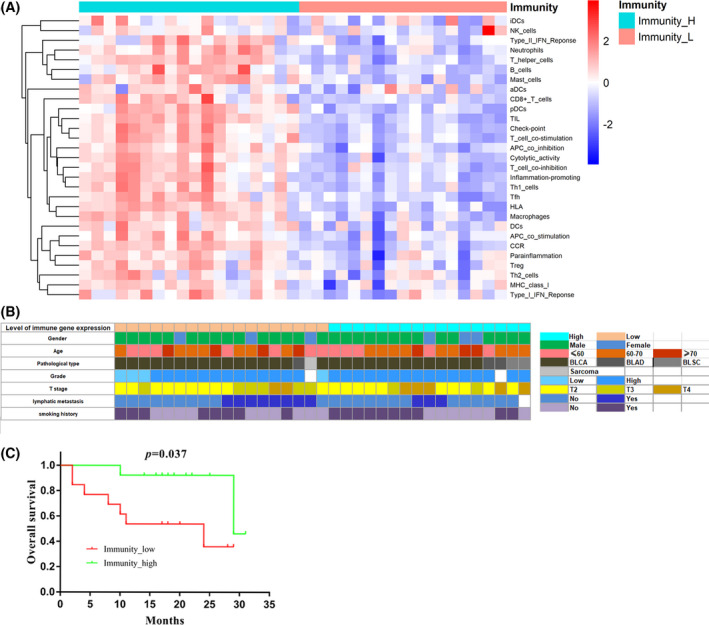
FIGURE 1.

Immunophenotyping of MIBC based on ssGSEA. A, Clustering of 29 immune signatures. Immunity_H, immunity‐high; Immunity_L, immunity‐low. B, Clinical parameter of 35 patients with MIBC. C, Kaplan‐Meier curves for overall survival of MIBC patients (n = 27) by Immunophenotyping. Immunity‐high (n = 14); Immunity‐low (n = 13). p: p value of Log‐Rank test; p < 0.05 was considered to indicate statistical differences
