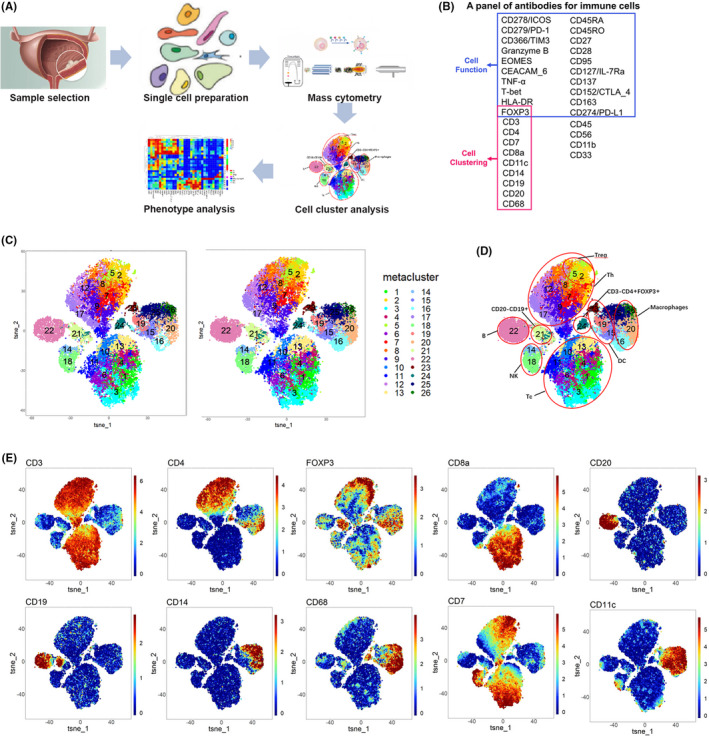
FIGURE 3.

Description of immune microenvironment by CyTOF. A, Workflow of CyTOF. B, Antibodies panel of CyTOF. C, The t‐SNE maps of the immunity‐high and immunity‐low groups. D, The t‐SNE maps of antibodies for cell typing. E, The t‐SNE maps of tumor‐infiltrating immune cells in cancer tissues of 35 patients with MIBC
