FIGURE 4.

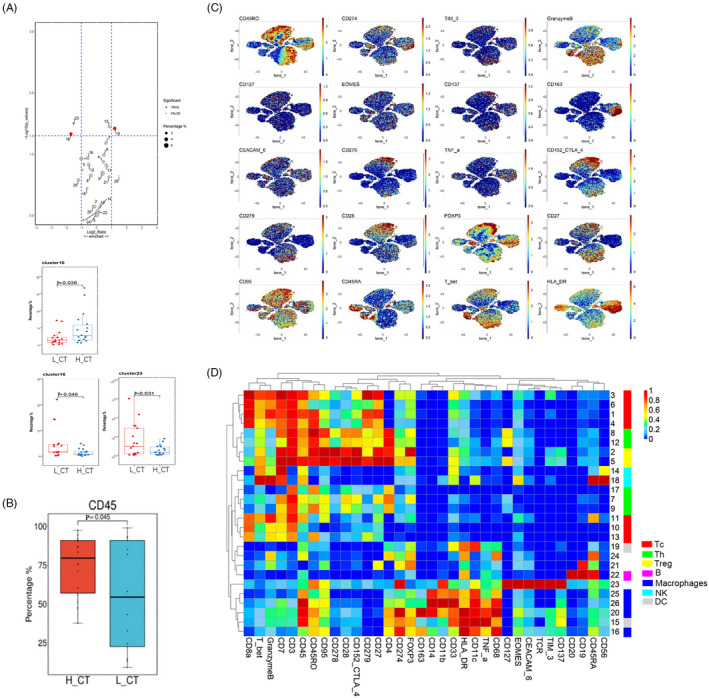
Differences of immune cell composition and function between the immunity‐high and immunity‐low groups A, Volcano plot and Box plots showed the differential expressed tumor‐infiltrating immune cell subsets between the immunity‐high and immunity‐low groups. H_CT: cancer tissues of immunity‐high group; L_CT cancer tissues of immunity‐low group. Red dots represented the significantly differential expressed cell subsets (|Log2(foldchange)| >1 and p < 0.05). Gray dots represented the non‐significantly differential expressed cell subsets (|Log2(foldchange)| <1 or p > 0.05). B, Box plots show differentially expressed of tumor‐infiltrating lymphocytes between the immunity‐high and immunity‐low groups. C, The t‐SNE maps of antibodies for cellular function. D, The heatmap showed expressions of 34 markers in 26 tumor‐infiltrating immune cell subsets. p: p value of t‐test or Mann‐Whitney U test; p < 0.05 was considered to indicate statistical differences
