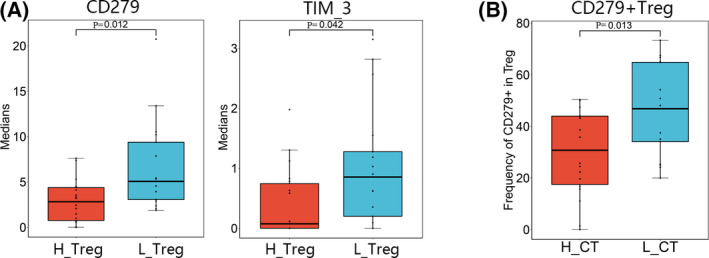
FIGURE 5.

Differential maker expressions of Tregs and frequency of PD‐1+ Treg between the immunity‐high and immunity‐low groups. A, Box plots showed differentially expressed of CD279 (PD‐1) and TIM‐3 on Tregs between the immunity‐high and immunity‐low groups. H_Treg: Treg in the immunity‐high group; L_Treg: Treg in the immunity‐low group. B, Box plot showed differential frequency of CD279+ (PD‐1) Treg between the immunity‐high and immunity‐low groups. H_CT: cancer tissues of immunity‐high group; L_CT cancer tissues of immunity‐low group. p: p value of t‐test or Mann‐Whitney U test; p < 0.05 was considered to indicate statistical differences
