
FIGURE 2.
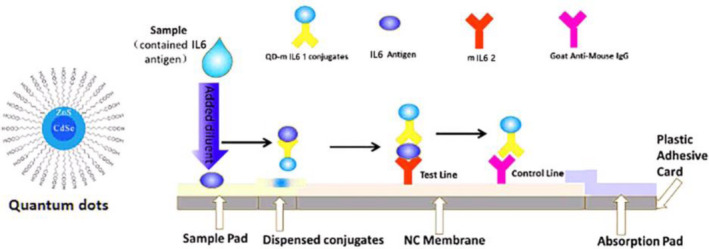
Illustration of the QD‐based LFIA strip and fluorescence signals when detecting different concentrations of IL‐6
Official websites use .gov
A
.gov website belongs to an official
government organization in the United States.
Secure .gov websites use HTTPS
A lock (
) or https:// means you've safely
connected to the .gov website. Share sensitive
information only on official, secure websites.
Illustration of the QD‐based LFIA strip and fluorescence signals when detecting different concentrations of IL‐6