
Fig. 1. Immune landscape of severe COVID-19 and bacterial pneumonia.
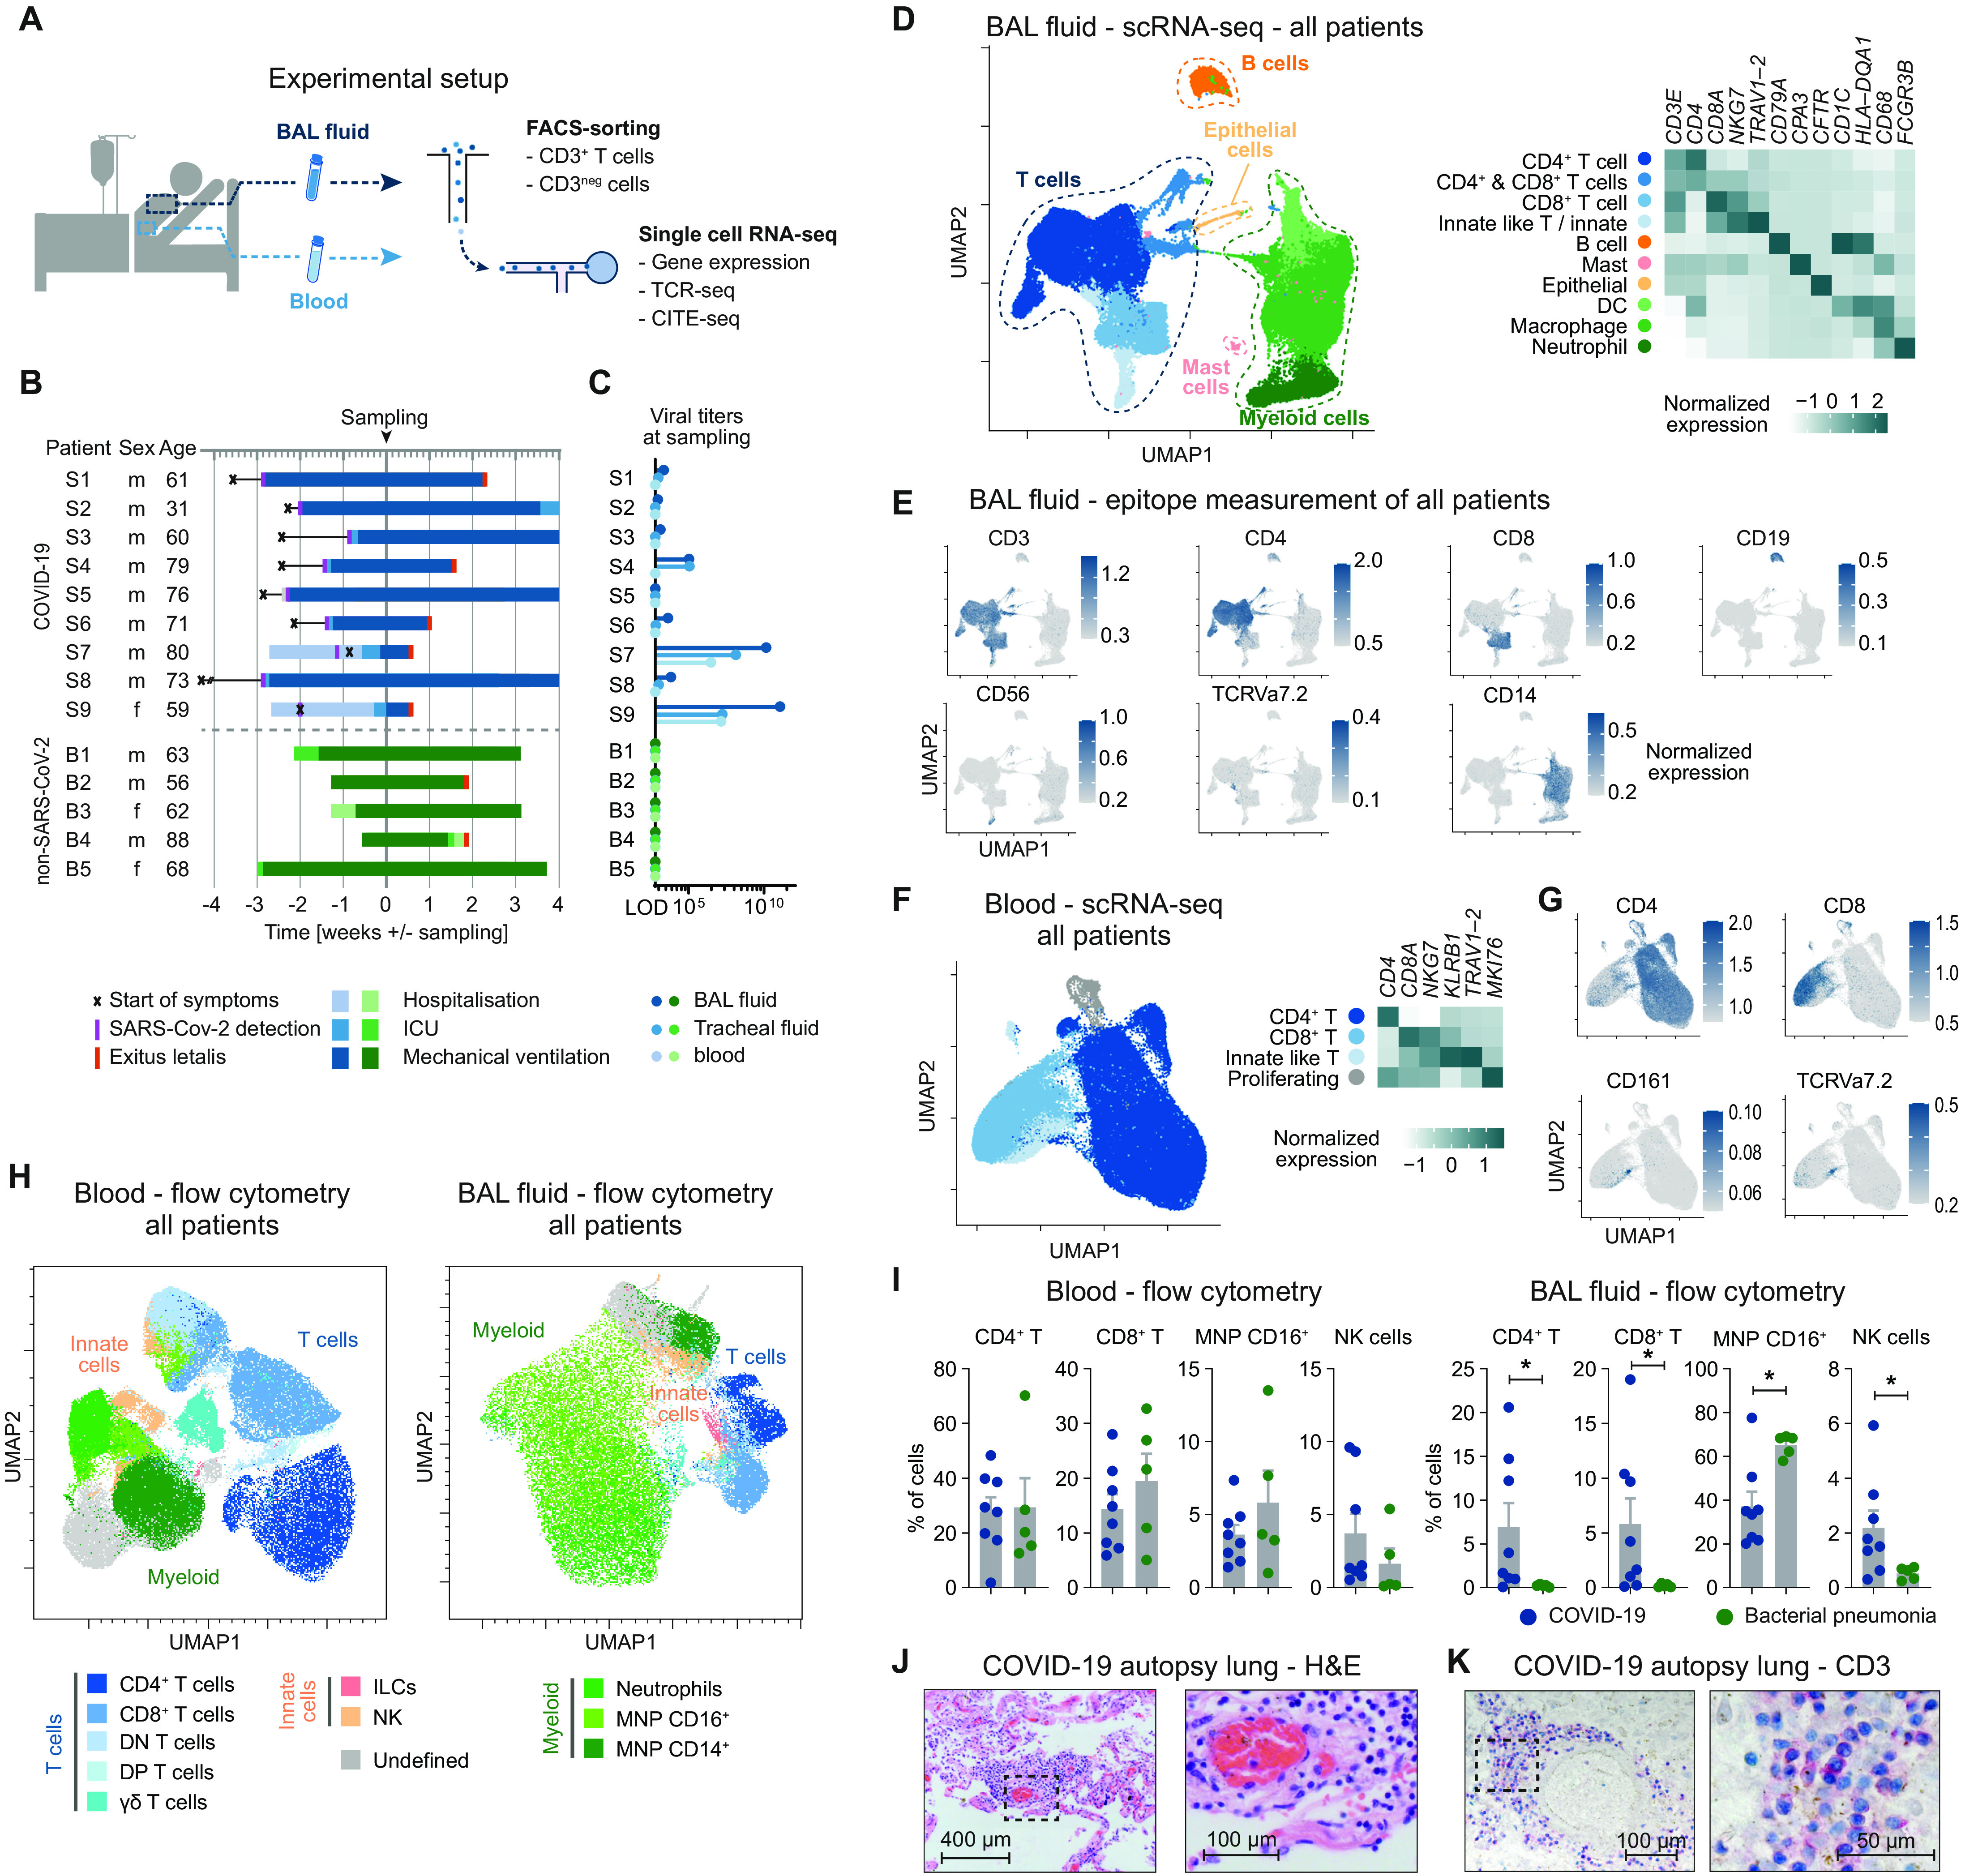
(A) Schematic representation of experimental setup. (B) Overview of baseline characteristics and clinical course of patients with COVID-19 and patients with bacterial pneumonia (LOD, limit of detection; ICU, intensive care unit). (C) Virus titers measured by quantitative polymerase chain reaction from BALF, tracheal fluid, and peripheral blood at time of sampling. (D) UMAP dimensionality reduction embedding of all cells from BALF (n = 56,735 cells, n = 8 for COVID-19, and n = 4 for bacterial pneumonia, samples of patients S6 and B1 were excluded for technical reasons) colored according to cell type assessed by gene expression and (E) epitope measurement using CITE-seq of key markers (scale bars indicate normalized expression). (F) Single-cell analysis of CD3+ T cells from peripheral blood of all patients (n = 77,457 cells, n = 7 for COVID-19, and n = 4 for bacterial pneumonia). (G) CITE-seq information of cluster-defining epitopes (scale bars indicate normalized expression). (H) Flow cytometry of peripheral blood and BALF of patients with COVID-19 (n = 8) and bacterial pneumonia (n = 5). Per patient, an equal number of viable CD45+ cells were exported for analysis and concatenated together before calculating the UMAP (total cells in peripheral blood = 129,141; in BALF = 114,927). Cell types were defined according to cell surface expression profiles by manual gating. Patient S9 was excluded from the statistical analysis due to low cell numbers. (I) Comparison of cell frequencies as measured by flow cytometry of cells from patients with COVID-19 and bacterial pneumonia (*P < 0.05). (J) Hematoxylin and eosin staining (H&E) and (K) CD3 staining of lung autopsy tissue of one representative of seven patients.