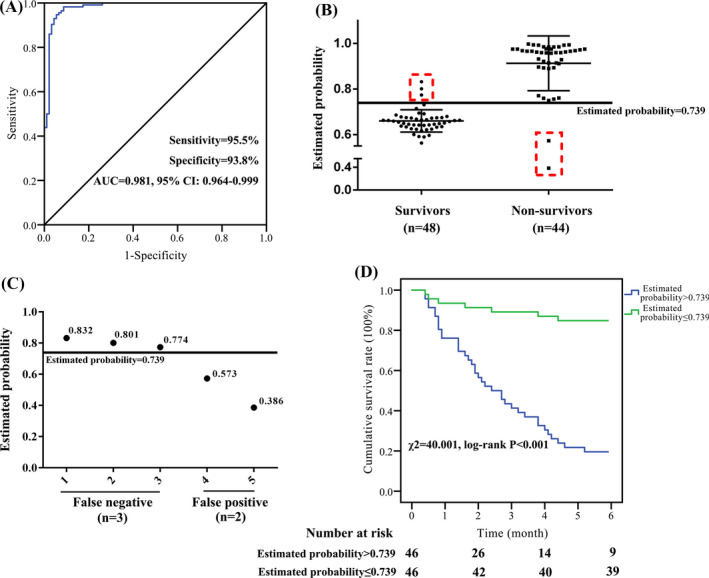
FIGURE 4.

Logistic regression models for the prognostic assessment of hypertensive patients with ischemic stroke. A–C, ROC analysis of the prognostic assessment model [CTLA‐4, IMA, Lp‐PLA2, GFAP, and HCY] for hypertensive patients with ischemic stroke in the testing group. D, Compared with the estimated probability ≤0.739 group, the survival rate of hypertensive patients with ischemic stroke was significantly decreased in the estimated probability >0.739 group
