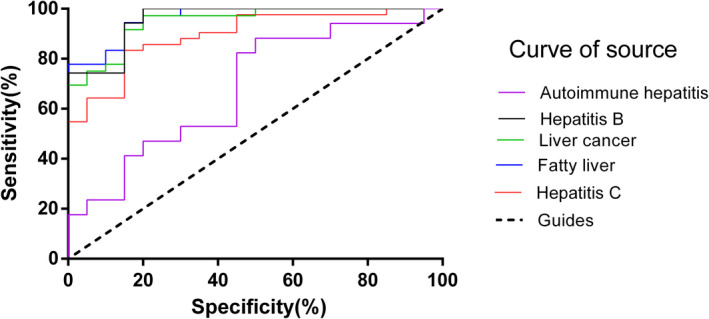
FIGURE 3.

ROC curve of liver cancer, hepatitis C, hepatitis B, autoimmune hepatitis, fatty liver disease patients, and the healthy controls. (Liver cancer: AUC = 0.94, sensitivity = 97.22%, specificity = 80%, cutoff = 609.8 pg/mL, p < 0.0001. Fatty liver: AUC = 0.96, sensitivity = 94.44%, specificity = 85%, cutoff = 639.2 pg/mL, p < 0.0001. Hepatitis C: AUC = 0.89, sensitivity = 83.33%, specificity = 85%, cutoff = 629.7 pg/mL, p < 0.0001. Hepatitis B: AUC = 0.95, sensitivity = 94.29%, specificity = 85%, cutoff = 629.8 pg/mL, p < 0.0001. Autoimmune hepatitis: AUC = 0.68, sensitivity = 47.06%, specificity = 80%, cutoff = 614.1 pg/mL, p > 0.05)
