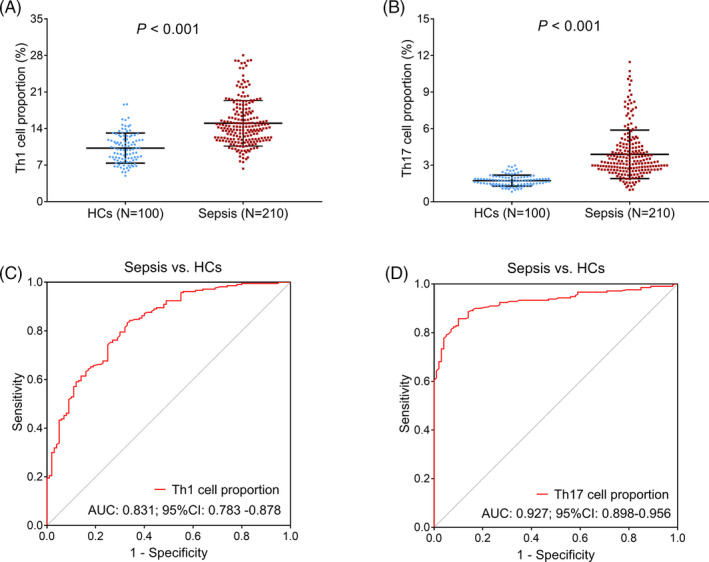
FIGURE 1.

Detection of Th1 and Th17 cell proportions in sepsis patients and HCs. Comparison of Th1 (A) and Th17 (B) cell proportions between sepsis patients and HCs. The value of Th1 (C) and Th17 (D) cell proportions in discriminating sepsis patients from HCs by ROC curves. Th, T helper; HC, healthy control; AUC, area under the curve; CI, confidence interval; ROC, receiver's operating characteristic
