
FIGURE 3.
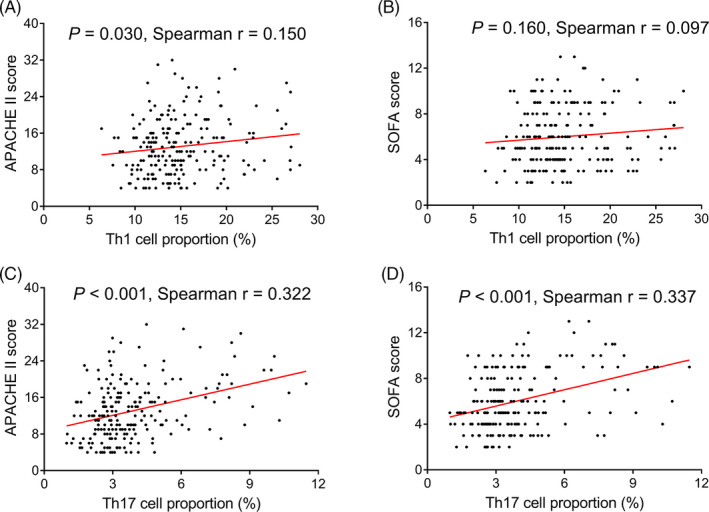
Correlation analysis in Th1 and Th17 cell proportions with disease severity in sepsis patients. Correlation in Th1 cell proportion with APACHE II score (A) and SOFA score (B). Correlation in Th17 cell proportion with APACHE II score (C) and SOFA score (D). Th, T helper; APACHE II, acute physiology and chronic health evaluation II; SOFA, sequential organ failure assessment