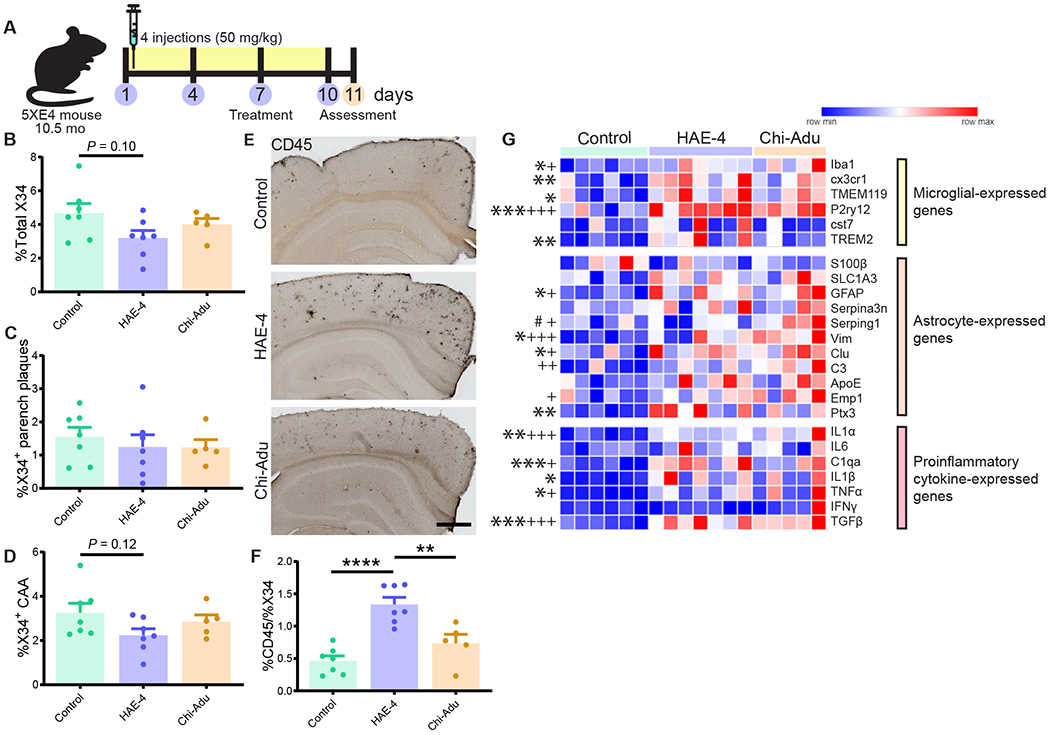
Fig. 5: Strong glial response after acute HAE-4 and chi-Adu peripheral administration.

A, Schematic design of 10.5-month-old 5XE4 mice injected once every 3 days for 4 times and assessed at 11 months-of-age. B–D, Quantification of total X34+ (B), parenchymal (C), and CAA (D) fibrillar plaques (Control IgG, n = 7; HAE-4, n = 7, chi-Adu, n = 5). E, F, CD45 (activated microglia) staining and quantification in cortex (Control IgG, n = 7 mice; HAE-4, n = 7 mice, chi-Adu, n = 5 mice). G, Heatmap analysis of bulk cortical microglial, astrocytic, and pro-inflammatory cytokine gene expression pattern by qPCR (Control IgG, n = 6; HAE-4, n = 7, chi-Adu, n = 5). “*” denotes statistical significance for HAE-4 versus control (*P < 0.05, **P < 0.01, ***P < 0.001); “+” for chi-Adu versus control (+P < 0.05, +++P < 0.001).; “#” for HAE-4 versus chi-Adu (#P < 0.05). Parench = Parenchymal. Control = Control IgG. Chi-Adu = Chimeric Aducanumab. Data expressed as mean ± SEM, one-way ANOVA with Tukey’s post hoc test (two-sided). *P < 0.05, **P < 0.01, ***P < 0.001, ****P < 0.0001. No other statistical comparisons are significant unless indicated.
