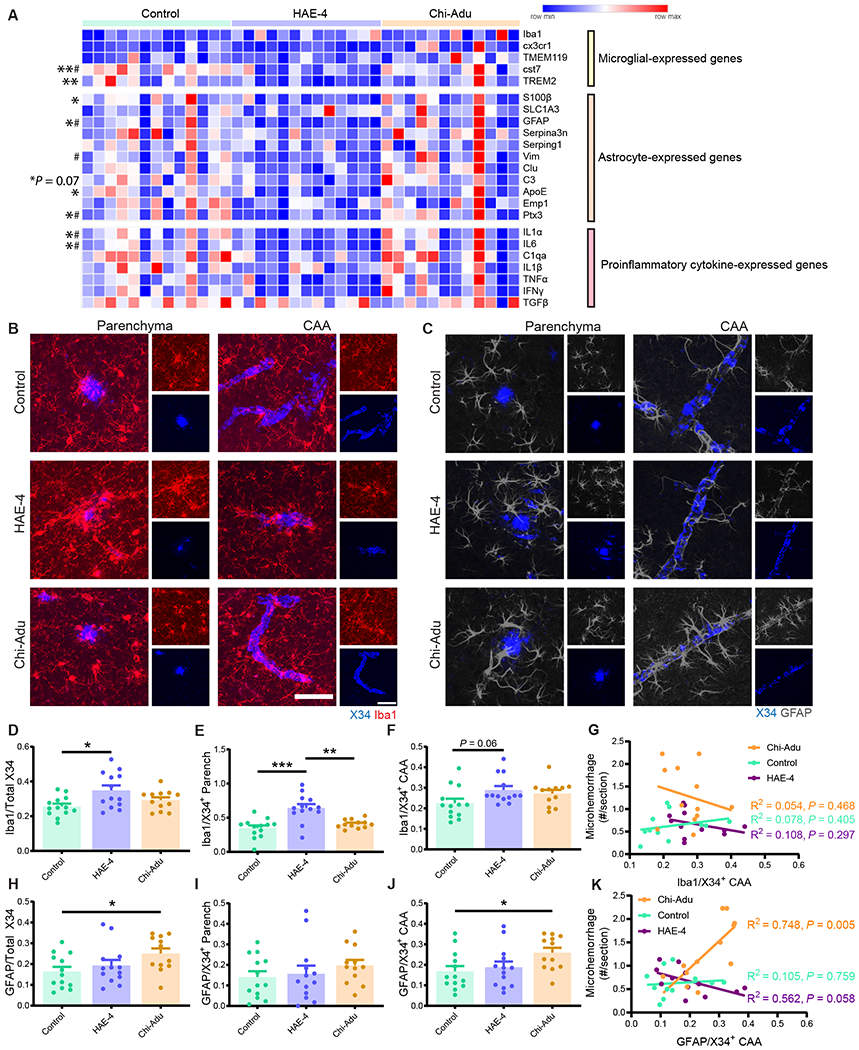
Fig. 6: HAE-4 and chi-Adu treatments stimulate differential glial responses to Aβ plaques and CAA.

A, Relative expression of microglial, astrocytic, and pro-inflammatory transcripts from bulk cortex of antibody-treated 10-month-old 5XE4 mice (50 mg/kg, weekly i.p. for 8 weeks; Control IgG, n = 13; HAE-4, n = 13, chi-Adu, n = 12) measured via qPCR, clustered by antibody treatment, and normalized to control IgG gene expression. “*” denotes statistical significance for HAE-4 versus control (*P < 0.05, **P < 0.01); “#” for HAE-4 versus chi-Adu (#P < 0.05). Genes analyzed using one-way ANOVA with Dunnett’s multiple comparisons test: S100β, GFAP, Vim, IL1α. One-way ANOVA with Tukey’s post hoc test (two-sided) unless otherwise noted. B–C, Representative images of co-staining using X34 for fibrillar plaques and Iba1 for microglia (B) or GFAP for astrocytes (C) in cortex. D–G, Percent area of Iba1+ microglia colocalized with total X34 (D), parenchymal (E), or CAA plaques (F), normalized to respective percent area of plaque load (Iba1+X34+/X34+). Microglial colocalization with CAA correlated to microhemorrhage number per section (G; Pearson correlation: r = 0.279, R2 = 0.078, P = 0.405, control IgG (n = 11); r = 0.329, R2 = 0.108, P = 0.297, HAE-4 (n = 12); r = 0.232, R2 = 0.054, P = 0.468, chi-Adu (n = 12)). H–K, Percent colocalization of GFAP+ astrocytes and total X34 (H), parenchymal (I), or CAA plaques (J), normalized to respective percent area of amyloid load (GFAP+X34+/X34+). Correlation between colocalized astrocyte/CAA and microhemorrhage number per section (K; Pearson correlation: r = 0.105, R2 = 0.011, P = 0.759, control IgG (n = 11); r = 0.561, R2 = 0.315, P = 0.058, HAE-4 (n = 12); r = 0.748, R2 = 0.560, P = 0.005, chi-Adu (n = 12)). Large panel: Scale bar = 50 μm. Small panel: Scale bar = 50 μm. Parench = Parenchyma. Control = Control IgG. Chi-Adu = Chimeric Aducanumab. Data expressed as mean ± SEM, one-way ANOVA with Tukey’s post hoc test (two-sided) for all group comparisons except Kruskal-Wallis test with Dunn’s multiple comparisons test (two-sided) for data not normally distributed (F, H, and I). *P < 0.05, **P < 0.01, ***P < 0.001, ****P < 0.0001. No other statistical comparisons are significant unless indicated.
