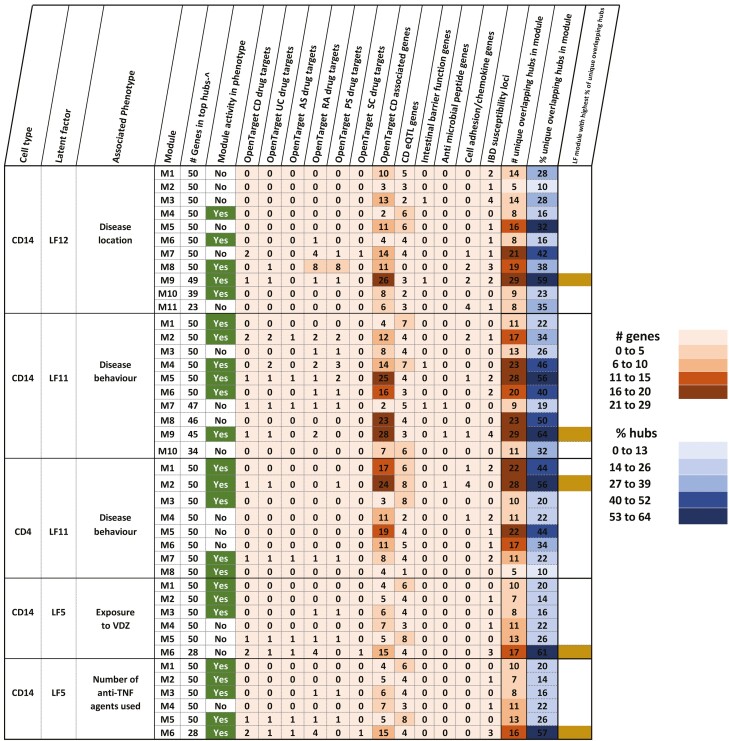
FIGURE 2.
A, Table depicting the explanatory LFs, which are defined as LFs associated with at least one clinical trait. The figure also shows the respective data sets that contribute to the variance explained by the LFs. By tracing the variance contributions to the LFs associated with the clinical traits, we could identify the -omic data sets contributing to the clinical trait. Latent factors associated with gender were discarded to exclude sex-specific signals. B, Summary of modules (derived from co-expression analysis, see methods section “Bioinformatic analyses” for more details), their relevance to the corresponding phenotypes (indicated by the column “Module activity in phenotype”), and the overlap between the hubs (top 50 genes) in each of the modules and targets of drugs used in intestinal inflammatory disorders such as Crohn’s disease and ulcerative colitis, other inflammatory disorders such as ankylosing spondylitis, rheumatoid arthritis, psoriasis, and sclerosing cholangitis, associations with CD, role as CD eQTLs or genes relevant to CD in terms of their activity (antimicrobial peptide functions, barrier functions, chemokine functions, and cell adhesion). ^ - if the total number of genes in a module was less than 50, all the genes in the module were considered as hubs. In the last column, the active modules with the highest percentage of unique overlapping hubs are indicated.


