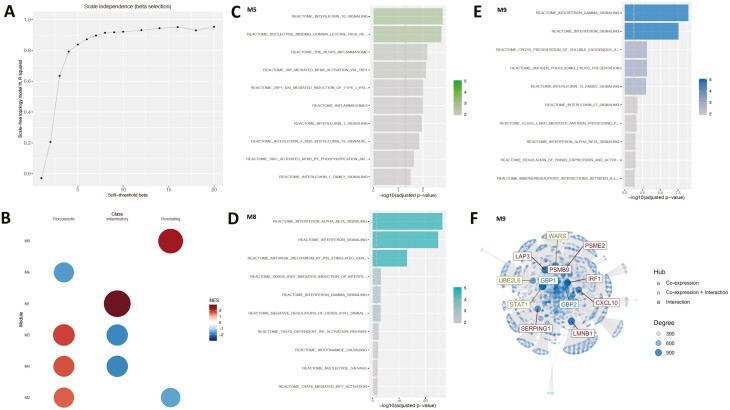
FIGURE 3.
A, The “scale-free” aspect of the modules (inferred from the monocyte gene expression) obtained over a window of values for the soft threshold beta parameter. Modules corresponding to the beta value of 8 was chosen because there was a plateauing of the observed “scale-free”-ness or aspect. Many real biological networks display scale-free behavior captured by the scale-free topology model fit R2 value plotted on the y axis. B, The activity profile of the monocyte gene expression modules in relation to the disease behavioral phenotype. Only the modules active with respect to the phenotype are displayed. The NES score represents the z-score normalized expression of the samples within each phenotype and is used to assess the alterations of module activity with respect to the phenotype. C, Overrepresented Reactome gene sets at FDR ≤ 0.05 in module 5, (D) in module 8 (E), and in module 9. F, The top 10 genes (hubs) identified in module 9 after integrating the co-expression network derived from module 9 with the benchmarked interaction network PCNet.43 Hubs are defined as nodes (genes) with a high connectivity (ie, number of neighbors) in the network and represent nodes that could play an active role in the given context.

